Supervision tools: our 2025 guide to choosing the right solution
Summary
- Definition: what is a supervision tool?
- Why integrate a monitoring solution into your company?
- How do you choose your supervision tool?
- Comparison of the best supervision tools (2025)
- Our solution at Four Data: IoT supervision at the heart of your performance
- How do you effectively implement a supervision tool?
- FAQ – Frequently asked questions about supervision tools
- Towards intelligent, agile and connected supervision

In a world of ever-increasing connectivity and critical infrastructures, IT supervision is no longer an option. It is at the heart of performance, safety and and reliability. From servers to IoT sensorssensors to enterprise networksevery element needs to be monitored in real timeto guarantee service continuity and avoid interruptions with potentially serious consequences.
But faced with a plethora of supervision softwarehow to choose the right solution ? What criteria should we rely on? And above all, what tool best suits your infrastructure and your business challenges ?
In this comprehensive guide, we offer you a structured and accessible analysis, based on our experience in developing supervision interfaces for connected objects. The aim: to help you make an informed choice, adapted to your business needs and technical environment.
Definition: what is a supervision tool?
What is it used for in IT and IoT environments?
A supervision tool is a software solution designed to monitor, analyze and control the key components of an IT system or connected infrastructure. In an IT or IoT environment, it plays a structuring role: it collects technical data at regular intervals, automatically analyzes it, generates alerts in the event of anomalies, and provides performance reports via a clear visual interface (often in the form of dashboards).
The aim is twofold: to guarantee the availability of digital services (servers, networks, applications) and optimize performance of the company. In the IoT context, these tools also enable the remote management of thousands of sensors and heterogeneous equipment.
Expert advice
“A high-performance IoT supervision tool must go beyond simple monitoring, enabling real-time visualization and contextual alerts.”
The three main categories: network, system, application
Supervision is divided into three main familieseach responding to specific issues:
- The network supervision monitors traffictraffic connectionsconnections physical equipment (switches, routers) and protocols protocols used.
- The system supervision focuses on serversservers memorymemory processorsand operating services.
- The application supervision monitors performance and availability of business applicationsdatabases or critical APIs.
Comparison table
| Category | Main purpose | Tool example | Monitored data |
|---|---|---|---|
| Network supervision | Monitor flows, access, bandwidth | PRTG, Nagios | Latency, traffic, port availability |
| System supervision | Monitor server resources and services | Zabbix, Centreon | CPU, RAM, disks, uptime, processes |
| Application supervision | Guaranteeing application availability | New Relic, Dynatrace | Response times, errors, logs, user experience |
Myth vs. Reality
“Not all supervision tools cover all layers. It’s common to combine several depending on your needs.”
Why integrate a monitoring solution into your company?
Modern digital infrastructures must meet a dual imperative: continuity of service and reactivity to incidents. In this context, integrating a monitoring tool becomes a strategic decision. Not only does it provide greater visibility on the actual state of systemsbut it also acts as a lever for operational optimization leveroptimization, reducing downtime, anticipating problems and strengthening performance management.
Particularly for industrial or agricultural companiesconnected IT supervision coupled with the IoT enable critical deviations to be identified upstream, and corrective action to be taken before incidents occur.
Proactive monitoring and fault anticipation
By analyzing the data from regular monitoring, the supervision tool detects abnormal behavior: load peaks, network latency, blocked services, etc. This type of alert enables you to intervene before service is degraded, thus avoiding production interruptions or infrastructure breakdowns.
Key figure
“80% of critical breakdowns can be avoided thanks to proactive supervision.”
Infrastructure security and compliance
Well-configured supervision enhances access controlmonitoring the status of critical serversand traces all suspicious events. This enables the company to meet regulatory requirements (RGPD, ISO 27001) while limiting vulnerabilities.
Point of caution
“Some solutions don’t natively integrate access management or full traceability.”
Optimizing IT performance and management
A supervision tool acts as a overall health indicator for the IT environment. By identifying under-utilized resources or bottlenecks, it facilitates decision-making: architecture resizing, load balancing, cloud cost reduction.
Before / after typical :
- Before manual verification tasks, late alerts
After automatic alerts, dynamic dashboards dashboards, improved resource allocation
Sectoral use cases: industry, energy, agriculture
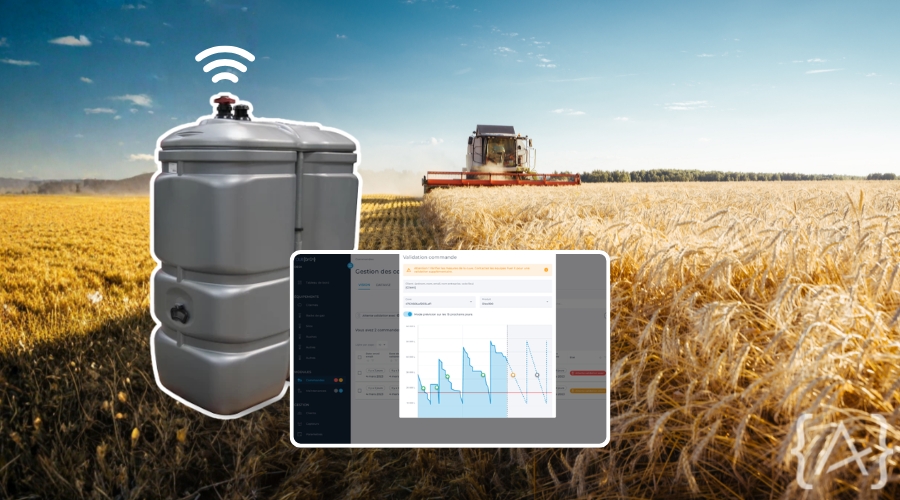
At Four Datawe supported the Val de Gascogne agricultural cooperativewhich wanted to better manage stock levels in its grain silos. Thanks to an IoT supervision solution integrated into our platform, the cooperative was able to :
- view the fill level of each silo at regular intervals;
- reduce losses due to supply overflows or shortages;
- optimize logistics and replenishment.
How do you choose your supervision tool?
Every IT infrastructure is unique. To ensure smooth, lasting integration, the choice of your supervision tool must be based on a set of objective criteria tailored to your real real needs. Here are the main elements to evaluate in order to make an informed decision:
- Compatibility with your technical environment (network, operating systems, IoT equipment)
- Advanced supervision features (intelligent alerts, customizable reports, multi-site management)
- Easy to deploy and use
- Interoperability with your existing tools (CMDB, ERP, CRM)
- Deployment mode (cloud or on-premise)
- Technical support and guidance
- Total cost of ownership (license, training, maintenance)
- Ability to grow with your infrastructure
📊 Summary table
| Criteria | Why is it important? |
|---|---|
| Network and system compatibility | To guarantee stable supervision without additional development |
| Rich functionality | To cover all levels: from server to application |
| Ease of use | To encourage adoption by operational teams |
| API integration and IoT connectors | For centralized, interoperable management |
| Scalability | To support infrastructure growth without overhaul |
| License type | To control costs according to your volume of data and equipment |
| Support | To secure the deployment and skills development of your teams |
Technical requirements and existing infrastructure
Each technical environment has its own specific features. Before choosing a supervision solutionit is essential to map your existing resources physical or virtual servers, network equipment, IoT sensors, critical applications…
Checklist
Before selecting your tool, check :
- Network type (LAN, WAN, LPWAN, etc.)
- Number of servers, routers, connected objects to be supervised
- Protocols used (SNMP, MQTT, OPC-UA, etc.)
- On-site, remote or hybrid supervision requirements
- Security constraints and RGPD
- Availability of your teams for initial set-up
Essential features
A good tool doesn’t just monitor. It must analyze, alert, report. Key features include :
- From customizable alertswith dynamic thresholds
- From automated reports and exportable
- A clear visualization via dashboards
- A ergonomic interface with multi-user management
The event correlation to detect root causes
Common mistakes
“Confusing supervision with log monitoring only.”
A supervision tool must offer a complete viewnot just a history of technical messages.
IoT interoperability & API integration
In a connected environment, a tool’s the ability of a tool to communicate with other systems is an essential criterion. L’ interoperability guarantees centralized managementand scalable management of your infrastructure.
📄 What to look for:
- Support for IoT protocols protocols: MQTT, CoAP, HTTP, LoRa, etc.
- Native connectors or REST/JSON APIs to interact with your business tools
- Integration with IoT management interfacesmanagement interfaces, databases or BI systems
This capability makes it possible to transform a simple monitoring into a genuine intelligent control interface.
Scalability, cost and support
The choice between a SaaS solution or on-premise solution will depend on your internal constraints (security, access management, technical resources). In addition to the license price, you’ll need to evaluate the the entire tool lifecycle of the tool: installation, training, support, updates, scalability.
📊 SaaS vs. On-premise
| Model | Key benefits |
|---|---|
| SaaS (cloud) |
Rapid deployment, automatic updates, low initial cost |
| On-premise | Total data control, extensive customization |
Key benefit
“A scalable solution avoids medium-term migration costs.”
Choose a tool capable of adapting to your growth, without major cost overruns or technical overhauls.
Comparison of the best supervision tools (2025)
In a constantly evolving market, choosing supervision software means comparing proven solutions on several criteria: available features, deployment capacity, adaptability to IoT infrastructuresinfrastructures, and total cost. Here is a selection of the most widely used and effective tools in 2025, according to the business and technical requirements.
General solutions (Nagios, Zabbix, PRTG…)
These tools cover a broad spectrum of network and system supervision. Robust and often modular, they provide a solid foundation for the critical infrastructure management.
- Nagios
A pioneering monitoring solution, Nagios enables highly granular monitoring of servers, services and network hostswith a plugins extensive range. Adapted to customized environments, it requires a certain level of configuration.
- Zabbix
Highly appreciated for its advanced visualizationZabbix combines real-time monitoring, automated alerts and customized reports. It features native support for protocols such as SNMP, JMX and IPMI. - PRTG Network Monitor
Designed for quick installation and an intuitive intuitive interfacePRTG offers preconfigured pre-configured probes for standard equipment. It is particularly suitable for companies needing centralized network supervision without technical complexity.
Open source & free solutions
Some solutions offer functional coverage at no license costideal for very small businesses or test environments.
- Icinga
A modern fork of Nagios, Icinga offers an optimized optimized web interfaceweb interface advanced notifications and distributed monitoring.
- Centreon (free version)
Centreon’s user-friendly French interface makes it easy to visualize network performance andaggregate metrics. Its free version covers basic needs, with optional pay-as-you-go modules.
Practical tip
“Testing an open source solution in a test environment helps keep start-up costs down.”
Cloud-native & IoT-enabled solutions
In connected and multi-site projects, the need for scalability, connectivity and centralized management require modern solutions.
- Datadog
As a SaaS platform with strong DevOps integration, Datadog provides real-time supervision of applications, servers, containers, etc. and connected objects. Its cloud model makes it a natural ally for elastic infrastructures.
- Uptime Kuma
Lightweight, open source and highly visual, Uptime Kuma efficiently monitors web services and applications with customizable dashboards. Although web-based, it can be coupled with IoT sensors via API. - Prometheus + Grafana
A formidable duo for cloud and microservice environments. Prometheus collects real-time metrics, while Grafana offers comprehensive visualization via dynamic dashboards. Their IoT integration is facilitated by extensive API compatibility.
Summary table: features, price, uses
| Name | Open Source ? | Main features | Features | Ideal for |
|---|---|---|---|---|
| Nagios | Yes | Host and service monitoring, custom plugins | Highly modular, but manual configuration | Experienced system administrators |
| Zabbix | Yes | Alerts, dashboard, prediction, auto-discovery | Multi-protocol support, high capacity | Medium and large enterprises |
| PRTG | No | Network probes, intelligent alerts | Fast deployment, smooth UX | SMEs looking for simplicity |
| Icinga | Yes | Distributed supervision, alerts, web UI | Modern and Nagios-compatible | Heterogeneous infrastructures |
| Centreon (free) | Yes | Dashboards, SNMP supervision | Made in France, expandable with modules | Local authorities, French-speaking companies |
| Datadog | No | Cloud monitoring, IoT, application traces | SaaS model, DevOps integration | Multi-cloud environments |
| Uptime Kuma | Yes | HTTP, Ping, ports monitoring | Simple UI, rapid deployment | Web or light services supervision |
| Prometheus + Grafana | Yes | Metric collection + visualization | Flexible, cloud-native architecture | Developers, IoT, Kubernetes |
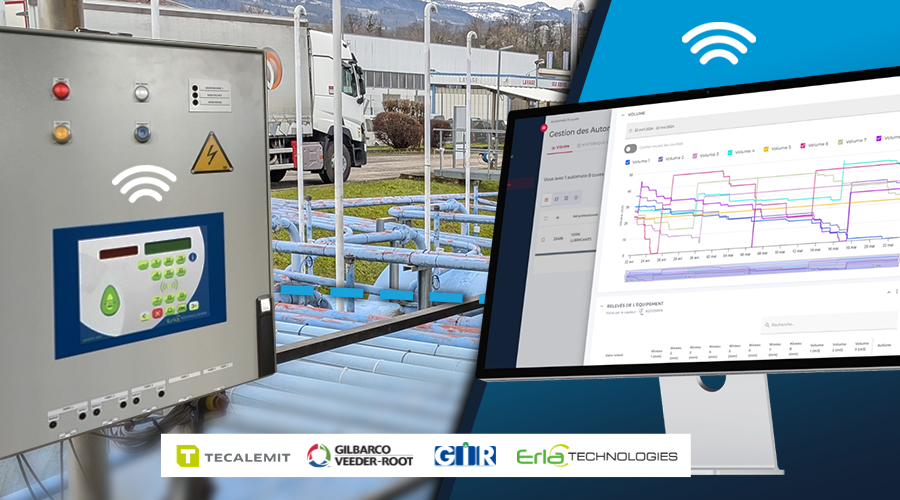
Our solution at Four Data: IoT supervision at the heart of your performance
At Four Data, we’ve designed a turnkey supervision solution for the most demanding industrial, energy and agricultural environments. Our platform is modular, agnostic (compatible with any type of sensor or network), and enables periodic monitoring of your infrastructures, with complete simplicity.
Frominstallation to customized interfacewe centralize all the layers of supervision – hardware, software and business – to guarantee smooth, predictive smooth, predictive management of your equipment. You keep control of your data, while benefiting from a hosted infrastructure that complies with the RGPD and secure.
This provides our customers with a actionable overview of their fleet, with relevant alerts and customized dashboards accessible in just a few clicks.
A centralized, modular and agnostic platform
We have developed a single interface interface to manage collection, analysis and visualization data from your equipment, regardless of manufacturer or communication protocol.
Compatible with LPWAN, NB-IoT, LTE-M or 4Gour solution adapts to any context: fixed, mobile, multi-site.
Key benefit
“A single tool to supervise dozens of sensor, equipment and sector typologies.”
Optimized monitoring of your connected objects
Our geographic dashboard gives you an view of the entire supervised fleet via an interactive map. Each sensor is displayed with its real-time status.
Features included :
- Focus only on critical information (status change, out-of-scope, threshold alert, etc.)
Automatic data summary by e-mail - Sentinel mode : readings taken every 5 minutes for maximum responsiveness
- Alert scenario engineautomated SMS or e-mail alerts
- In this way, you gain in reactivity while reducing field analysis time.
Smart alerts, dashboards and security
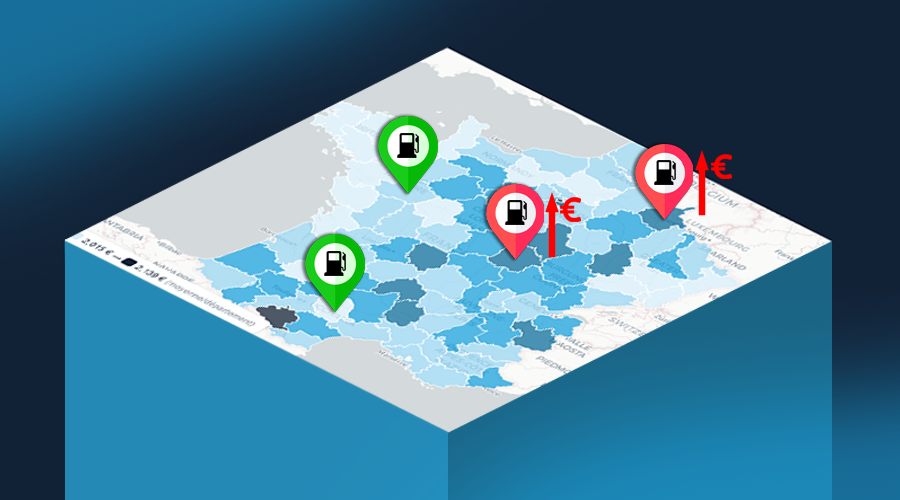
We have deployed our supervision solution for the Avril Group, through its Oleo100 brand, to monitor the level of vegetable fuel in several hundred tanks across France at regular intervals.
Before our intervention :
- Lack of inventory visibility
- Undetected breaks
- Late intervention by logistics teams
After Four Data deployment :
- Automated tank level monitoring (1 to 4 measurements per day)
- Drastic reduction in breakage
- Anticipation of replenishments via configurable alerts
- Fewer emergency interventions
The result: a reliable, greener and smoother supply chain.
How do you effectively implement a supervision tool?
For a monitoring tool deliver on its promises – visibility, alerts, continuous improvement – it must be deployed methodically. Here are the 5 essential steps to ensure a successful and lasting integration, whatever the size of your infrastructure.
1. Audit and definition of requirements
First and foremost, you need to analyze the existing situation type of equipment to be monitored, expected data volumes, measurement frequency, network architecture, regulatory constraints.
A good audit will identify critical supervision points and avoid blind spots from the outset.
2. Choosing the right solution
Based on the audit, it’s time to select the right software solution that meets the functional challenges (alerts, dashboards, security), as well as technical issues (communication protocol, interoperability, data volume).
The objective is to have an interface consistent with your useswithout unnecessary oversizing.
3. POC and on-site testing
A Proof of Concept (POC) is essential to validate the deployment in a real-life environment. It allows us to adjust the measurement parameters, alert thresholds and ergonomics of the portal before generalization.
Point of caution
“Neglecting the test phase can distort analysis of actual performance.”
4. Large-scale deployment
Once the POC has been validated, the solution can be extended to all sites or equipment. It is important to document deployment, support users and ensure effective skills transfer.
At Four Data, this phase includes turnkey commissioningincluding a service report and customized configuration.
5. Follow-up, support, scalability
Supervision is a living process. It requires a regular monitoring system performance, integrate changes in business requirements and adapt alerts and dashboards over time.
A responsive support and functional updates guarantee a long-lasting long-term solution.
FAQ – Frequently asked questions about supervision tools
Towards intelligent, agile and connected supervision
Visit IT supervision is no longer limited to fault detection. It becomes a strategic for companies that want to guarantee availability, protect their data and anticipate failures in an increasingly connected environment.
At Four Datawe transform this complexity into added valuethanks to a platform designed for the challenges of the field, and a comprehensive approach: from the sensor to control interface.
🎯 Ready to supervise your fleet intelligently?
📞 Contact our experts to build together your customized supervision solution.
You may also be interested in these articles :