
Optimised waste management: how Chamonix manages its delivery routes with 170 connected self-service waste collection points
Summary
- A valley that changes size every six months
- Twenty years of scheduled collection rounds
- 640 waste containers connected in eight weeks
- The real obstacle wasn’t the mountain
- The frustration nobody had anticipated
- A benefit that was in no specification
- A tool that learns seasonality, then flags the unexpected
- From route optimisation to sorting education
- What to remember if you manage a comparable area
- FAQ
- Do you manage a fleet of drop-off points?
13 min read · Published on 06/08/2026 · Smart Waste case study

In this article
- A valley that changes size every six months
- Twenty years of scheduled collection rounds
- 640 waste containers connected in eight weeks
- The real obstacle wasn’t the mountain
- The frustration nobody had anticipated
- A benefit that was in no specification
- A tool that learns seasonality, then flags the unexpected
- From route optimisation to sorting education
- What to remember if you manage a comparable area
- FAQ
A connected drop-off point is a waste collection container fitted with a sensor that measures its fill level and transmits the data to a supervision platform. Collection rounds are then triggered by the real threshold rather than by a calendar, which cuts mileage, fuel and pointless trips.
On 28 July 2026, at the height of the summer peak, not one of the 640 equipped containers was full. Twenty years of rounds organised on a schedule, fine-tuned by teams who know their patch, had produced a service with no overflows — even when the valley’s population multiplies by seven.
What the sensors bring isn’t a challenge to that work, it’s a measurement. For the first time, the Régie Intercommunale Chamonix Propreté knows exactly what each column holds before emptying it: enough to validate two decades of work, then to identify, with figures to back it up, concrete room for optimisation. Rounds tuned to real need, fewer kilometres driven, without degrading the service. Here’s how the project came together, and what it’s already teaching its teams.
The fleet at a glance
170 drop-off points, i.e. 640 connected containers:
- 282 containers for household waste
- 190 containers for recycling (selective collection)
- 168 containers for glass
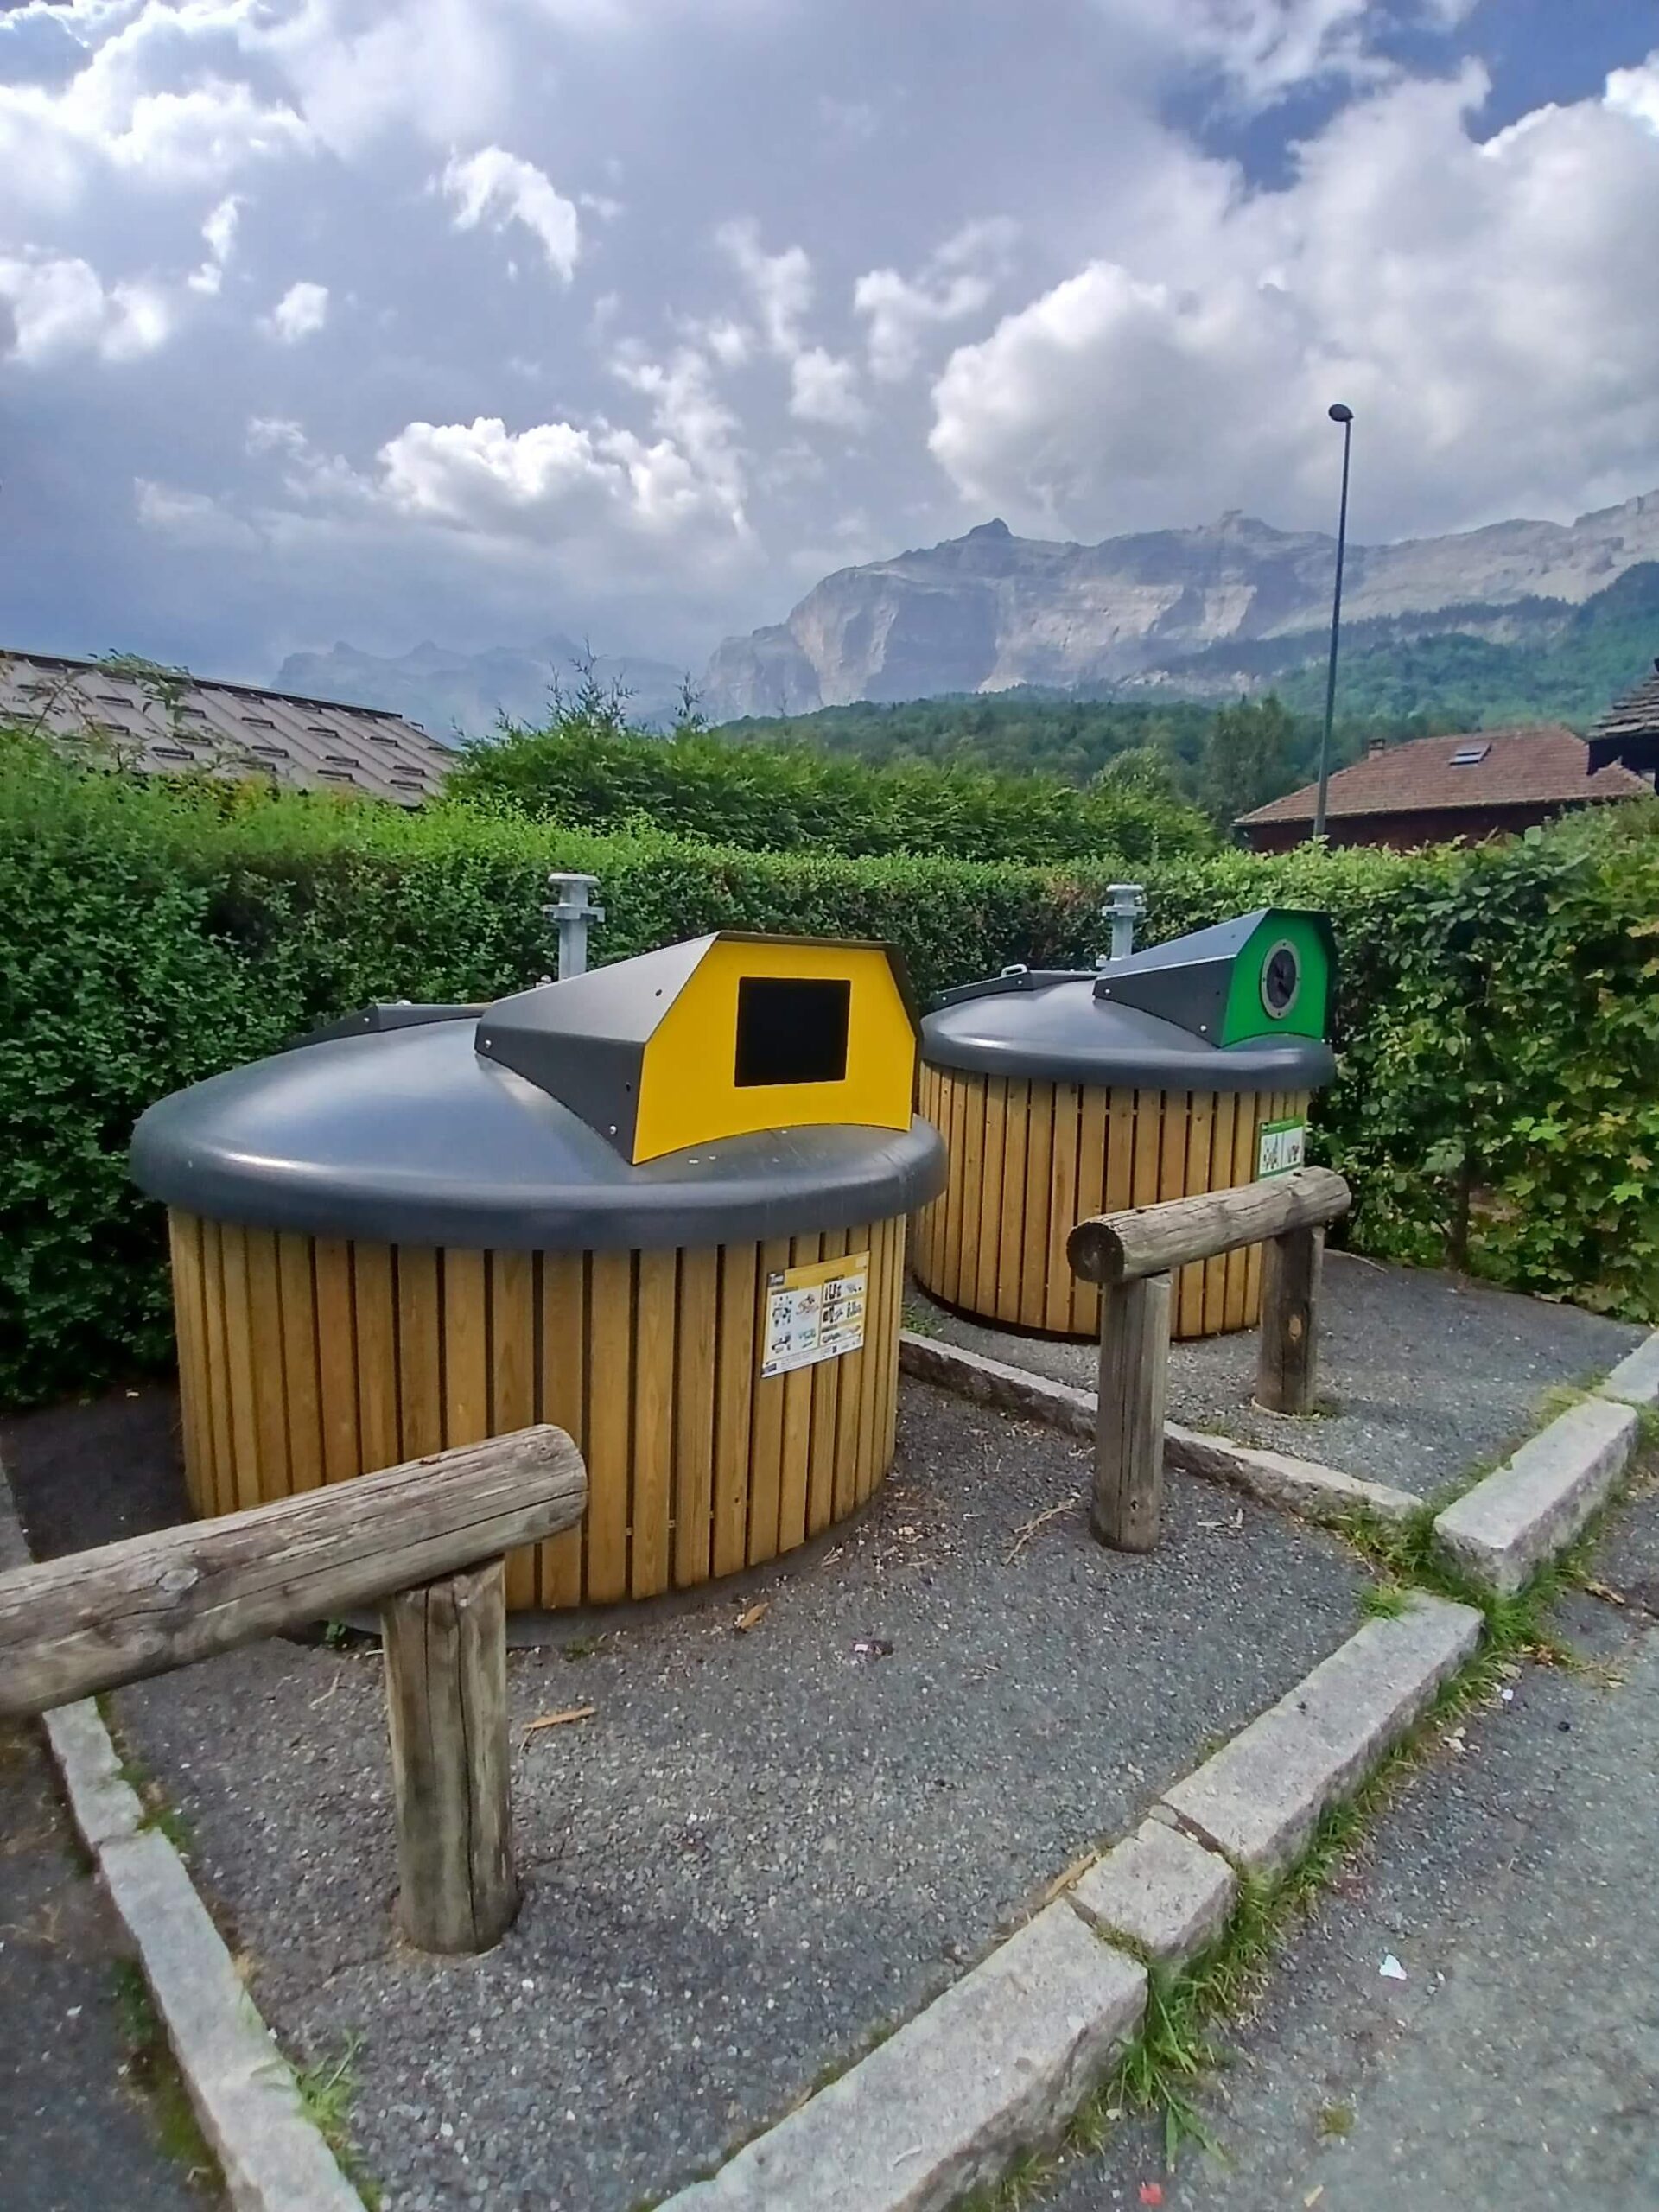
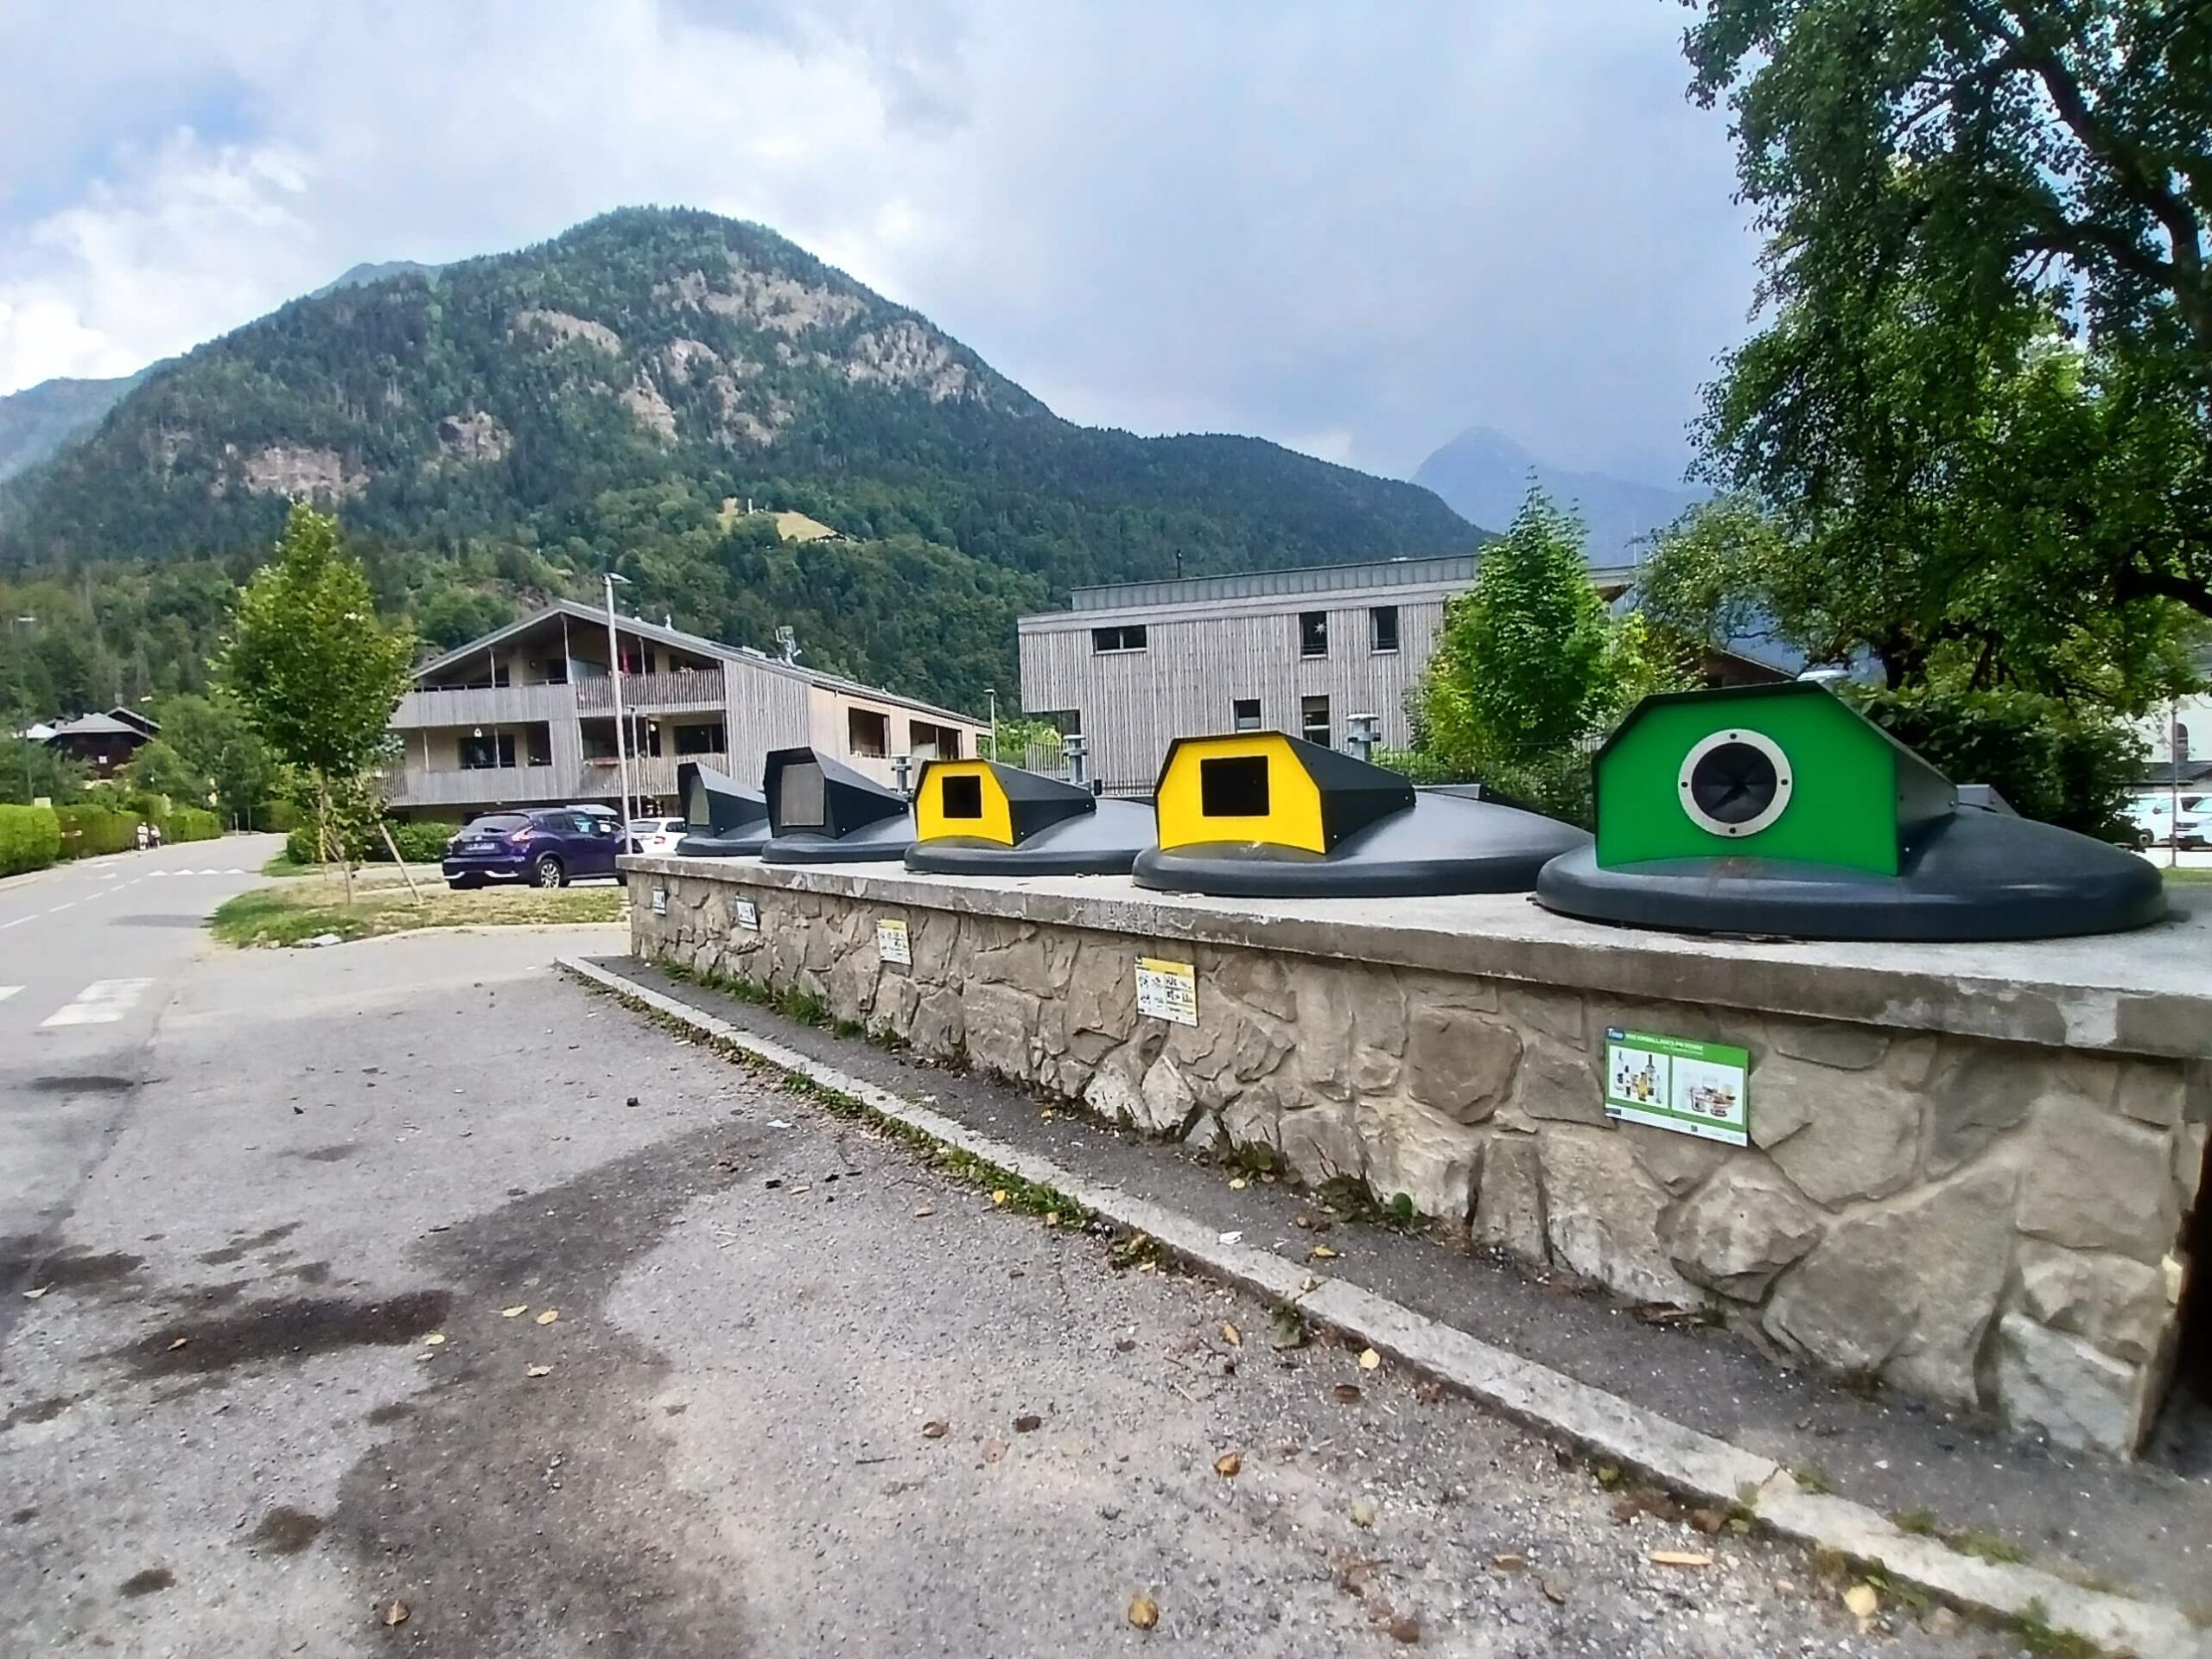
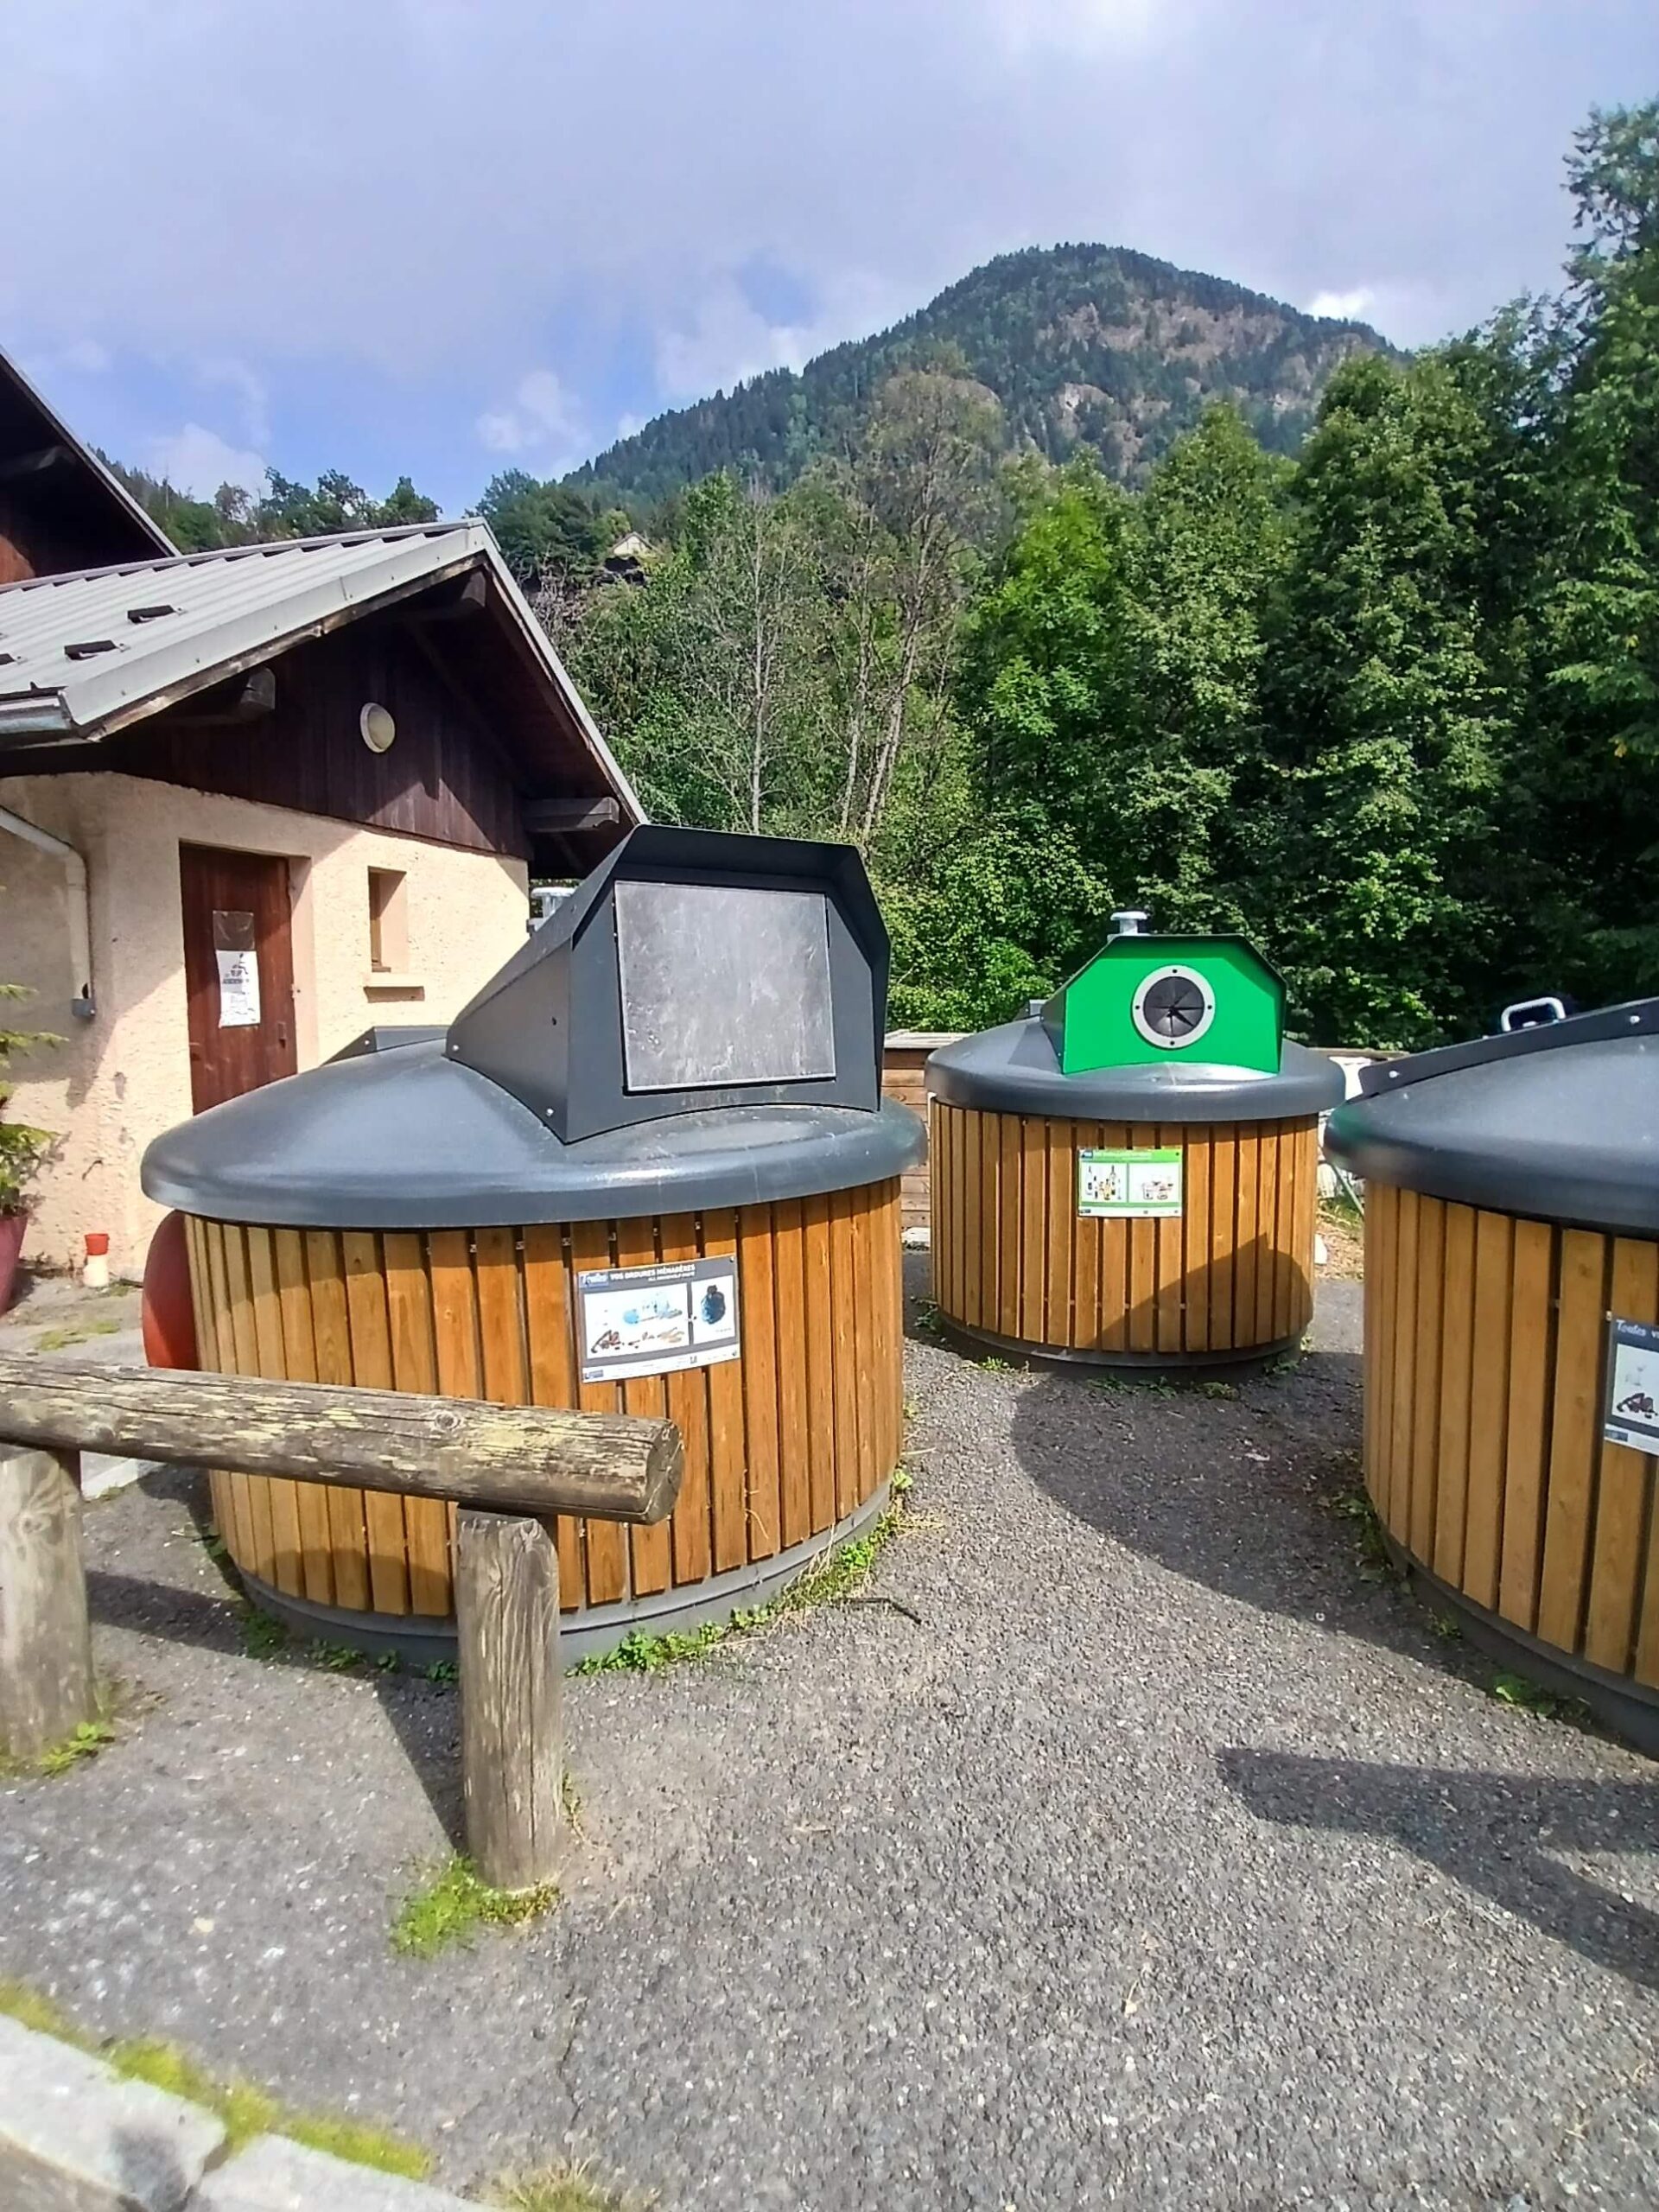
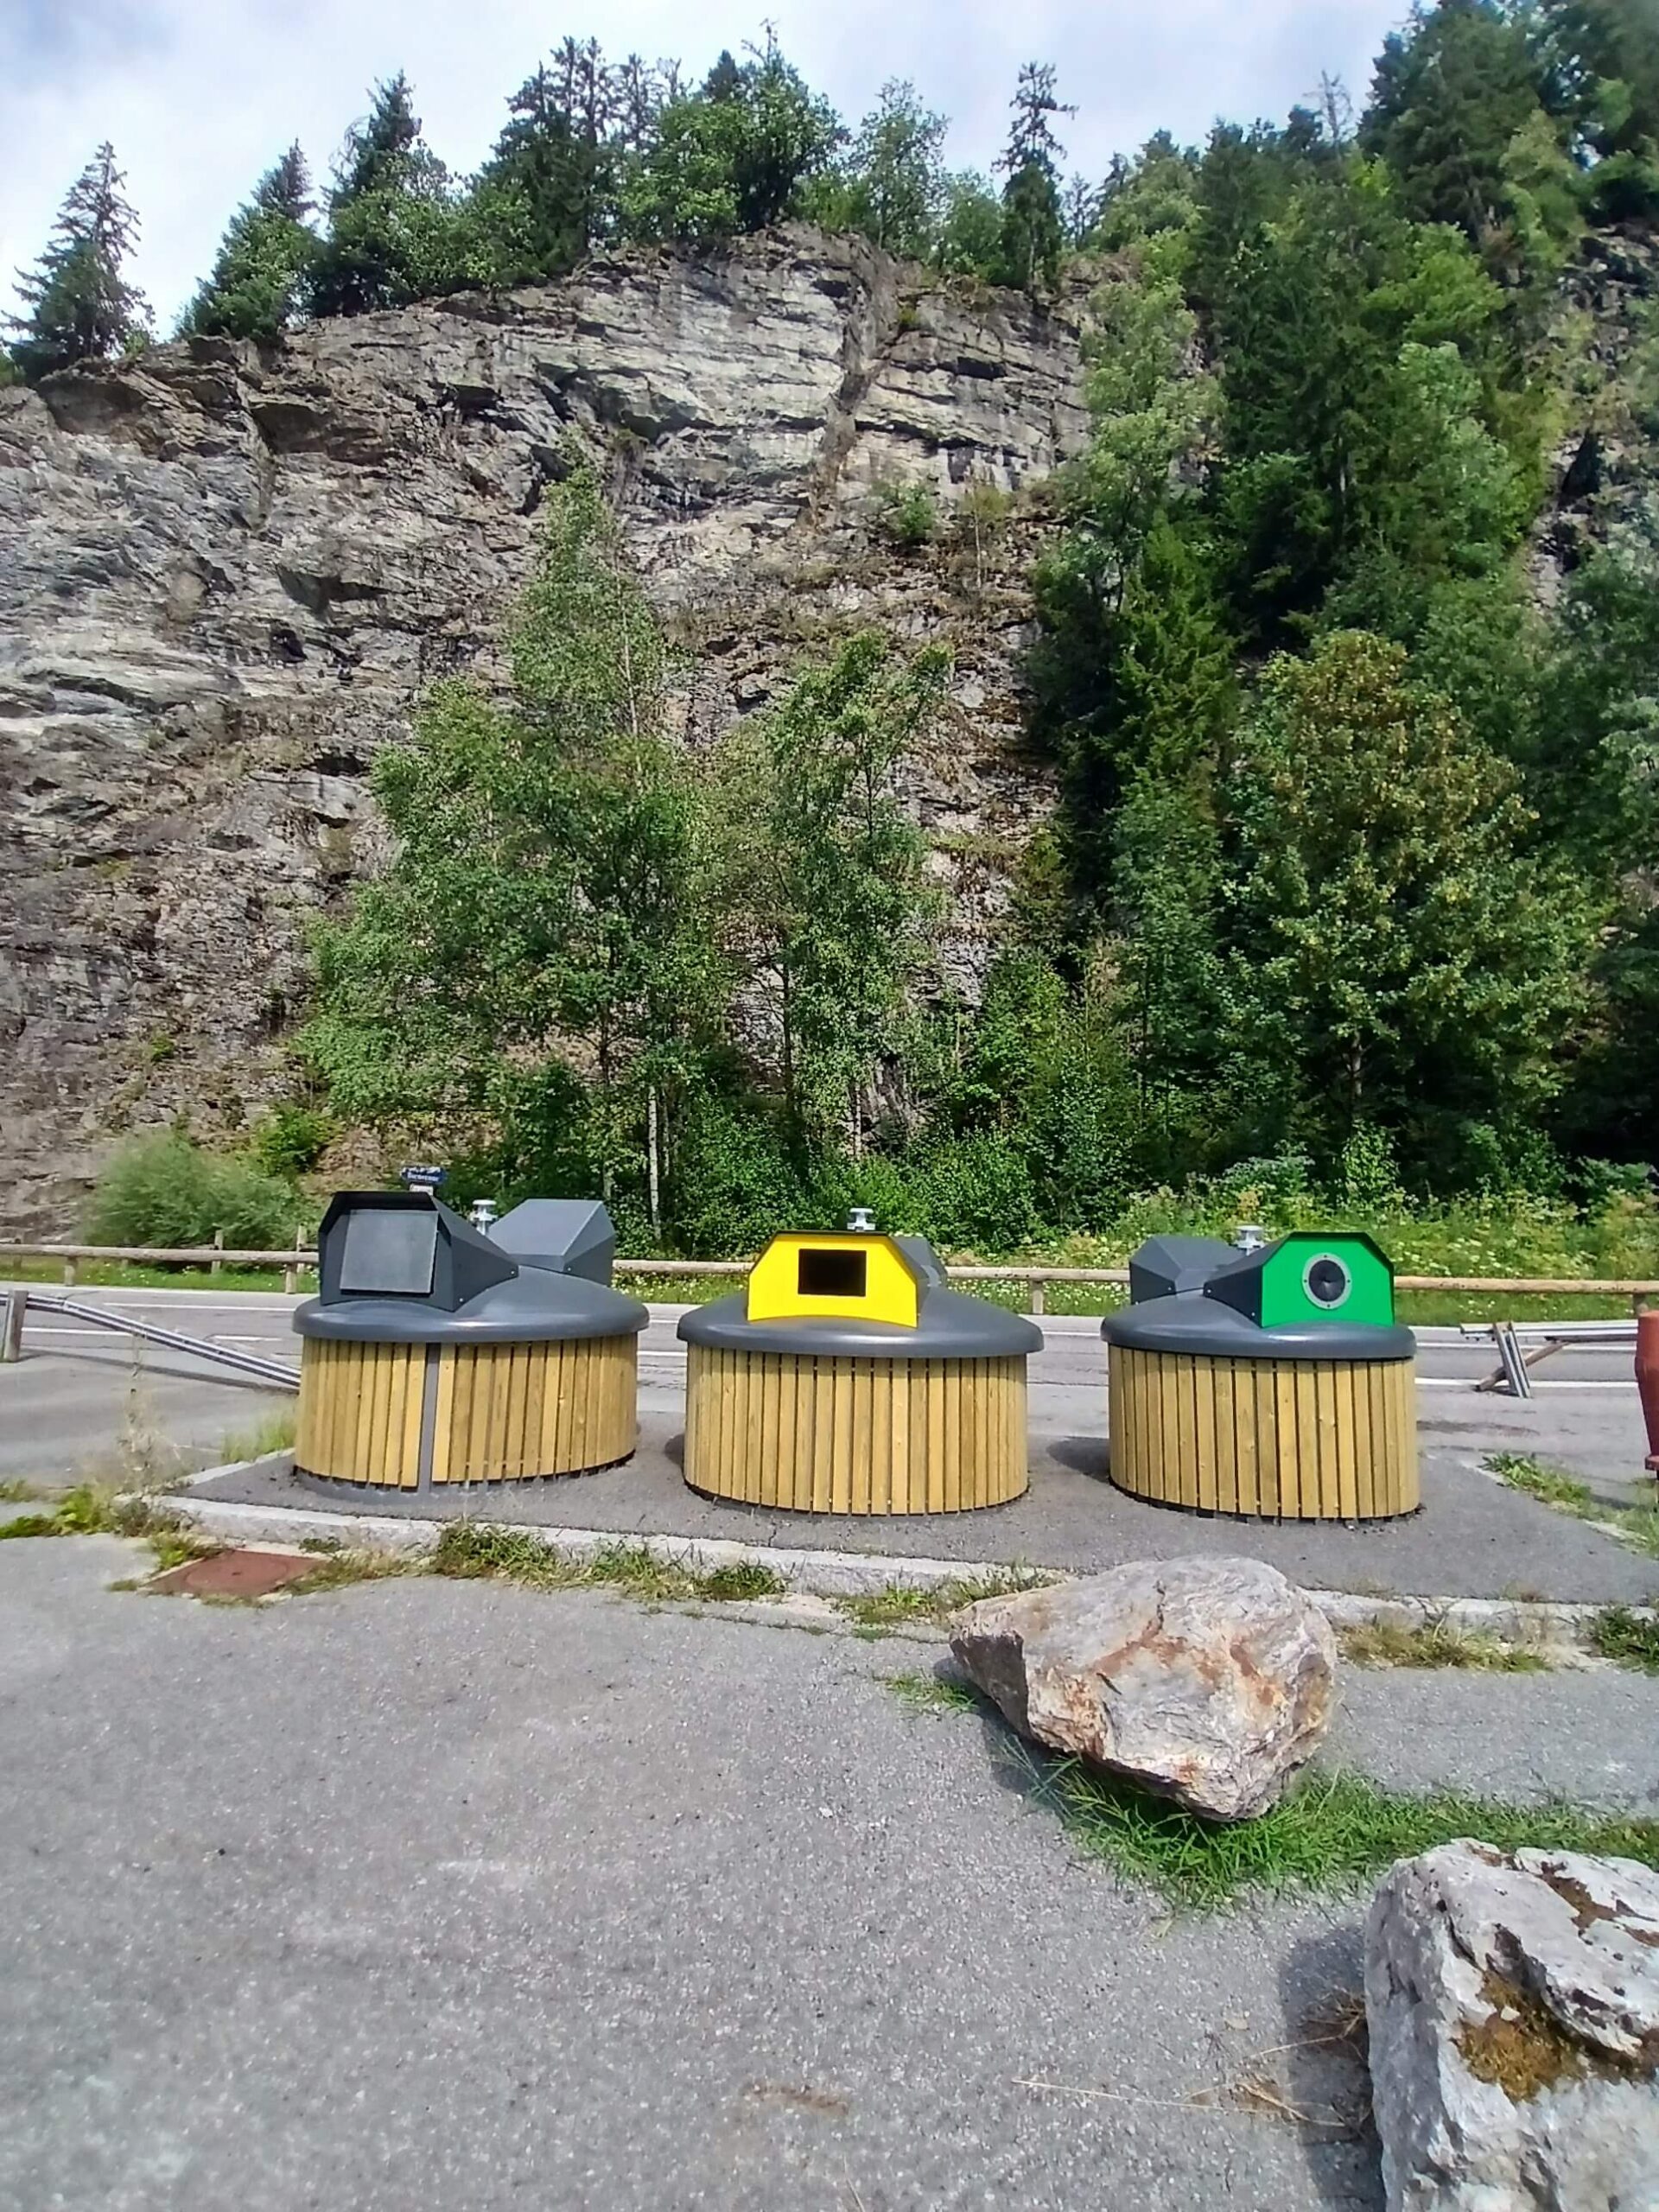
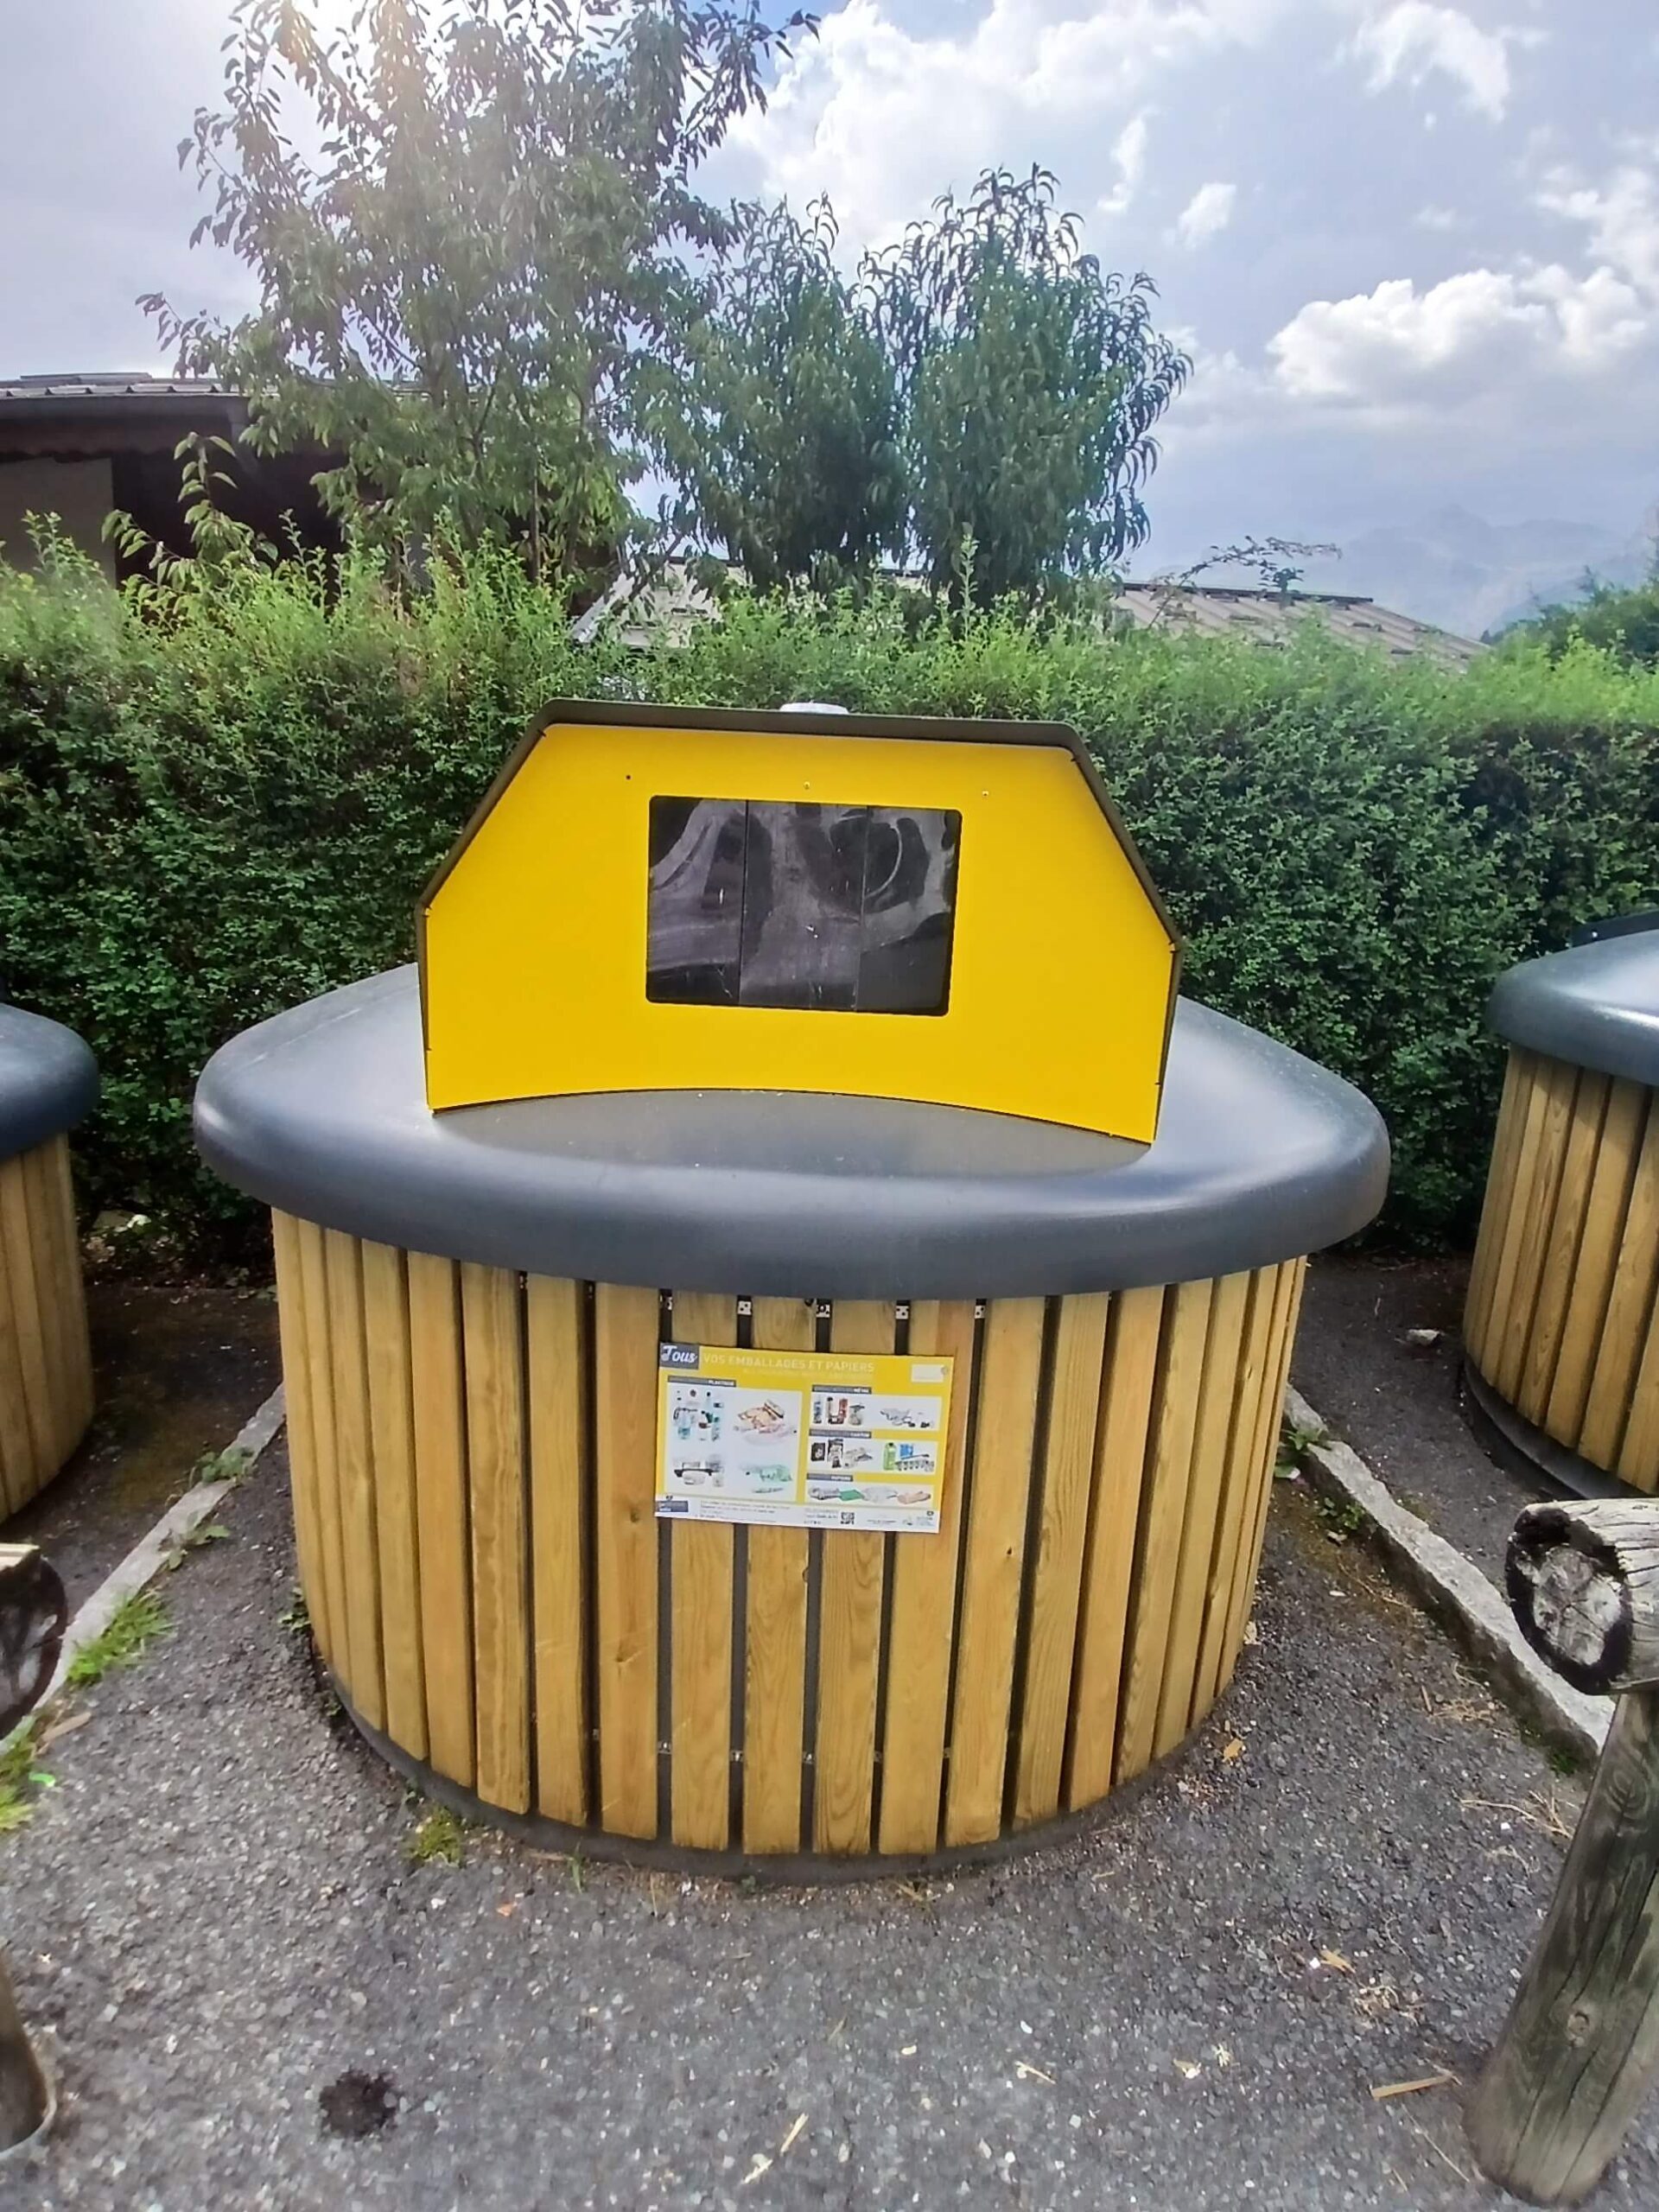
These columns come in three forms depending on the site: above-ground, semi-underground and underground.
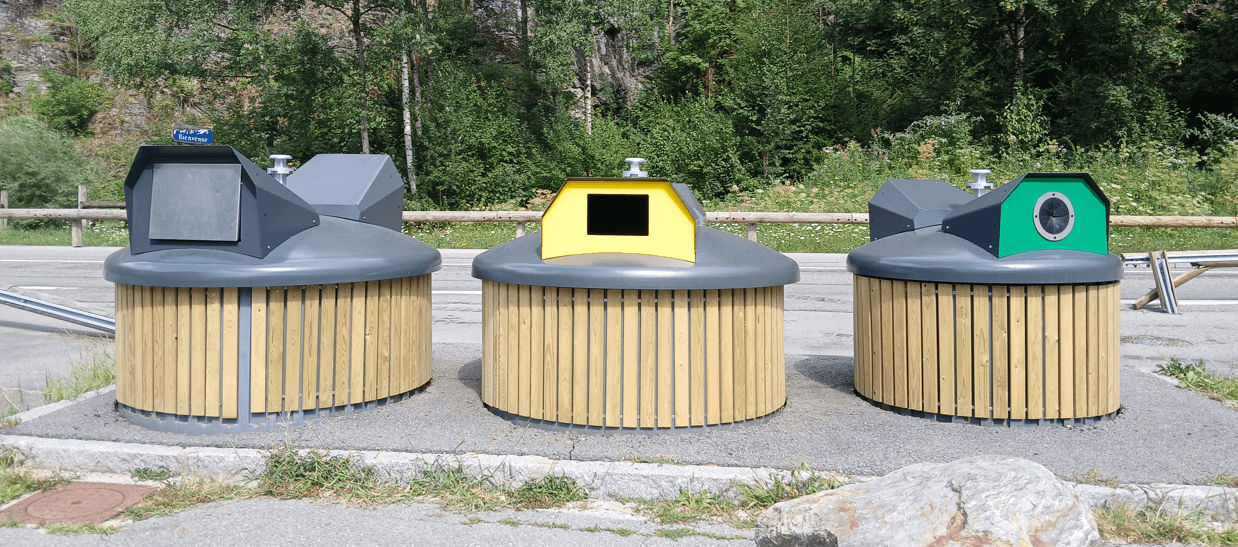
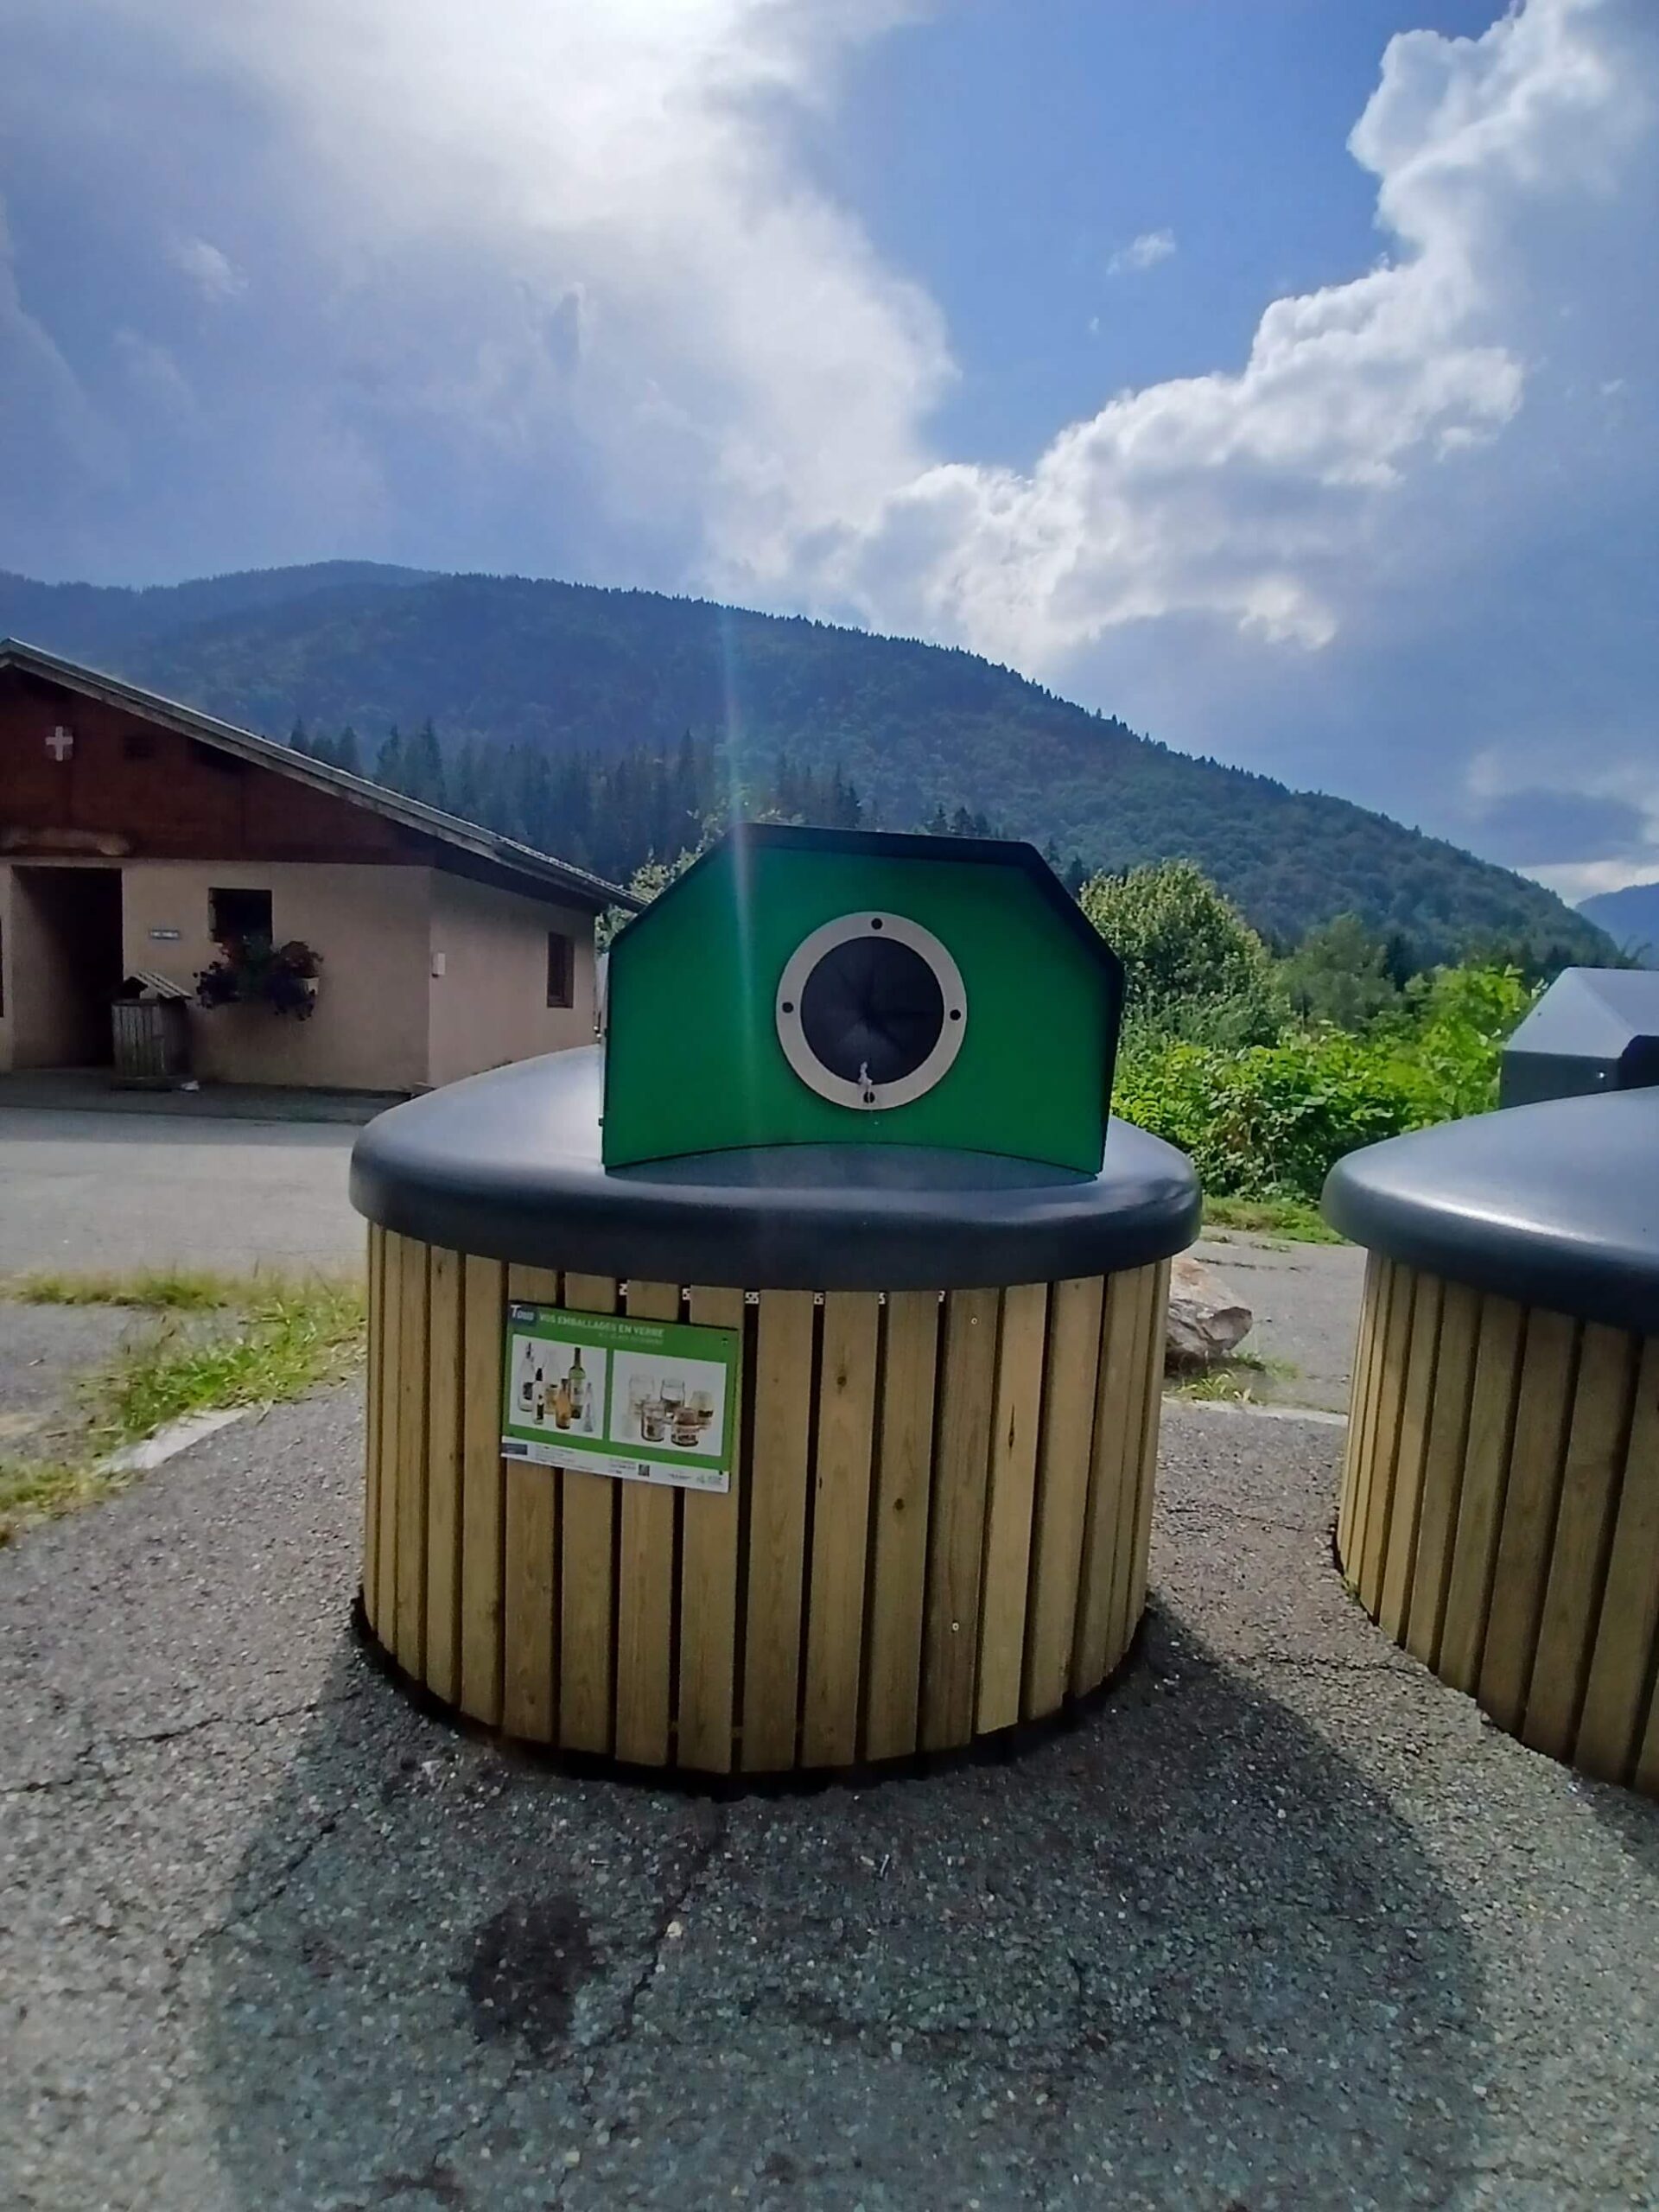
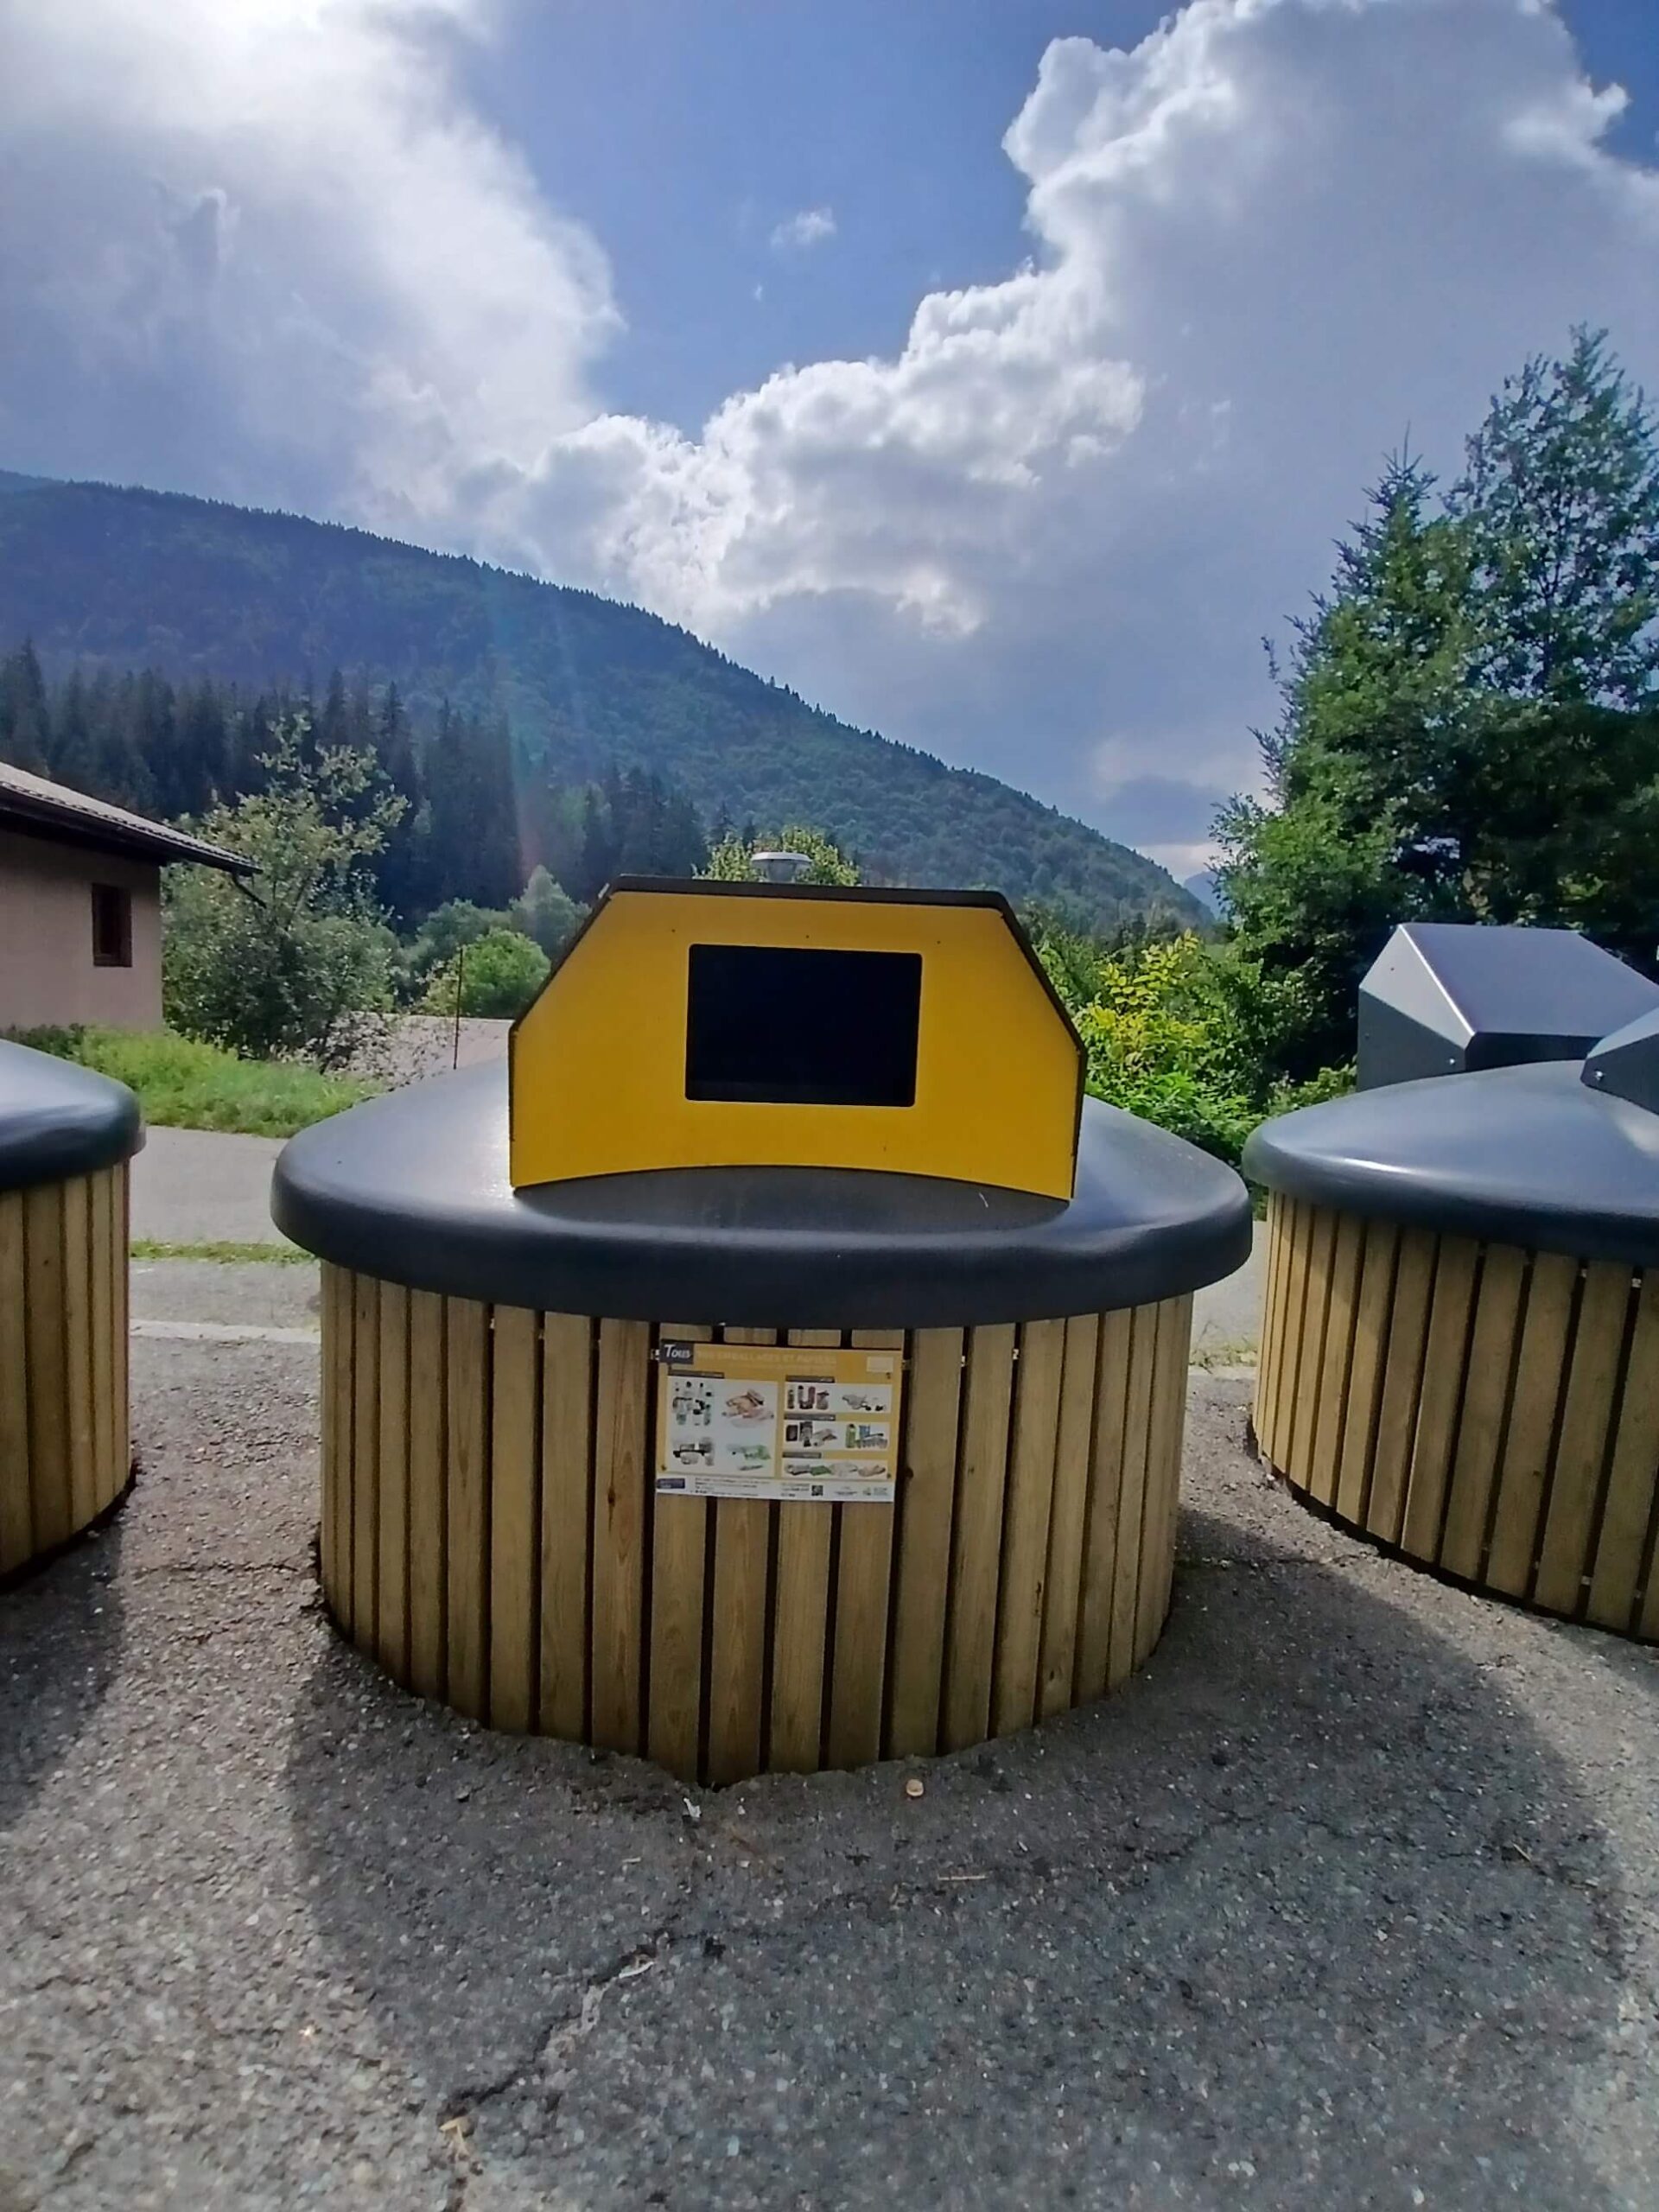
Three streams, three column types: household waste, recycling and glass
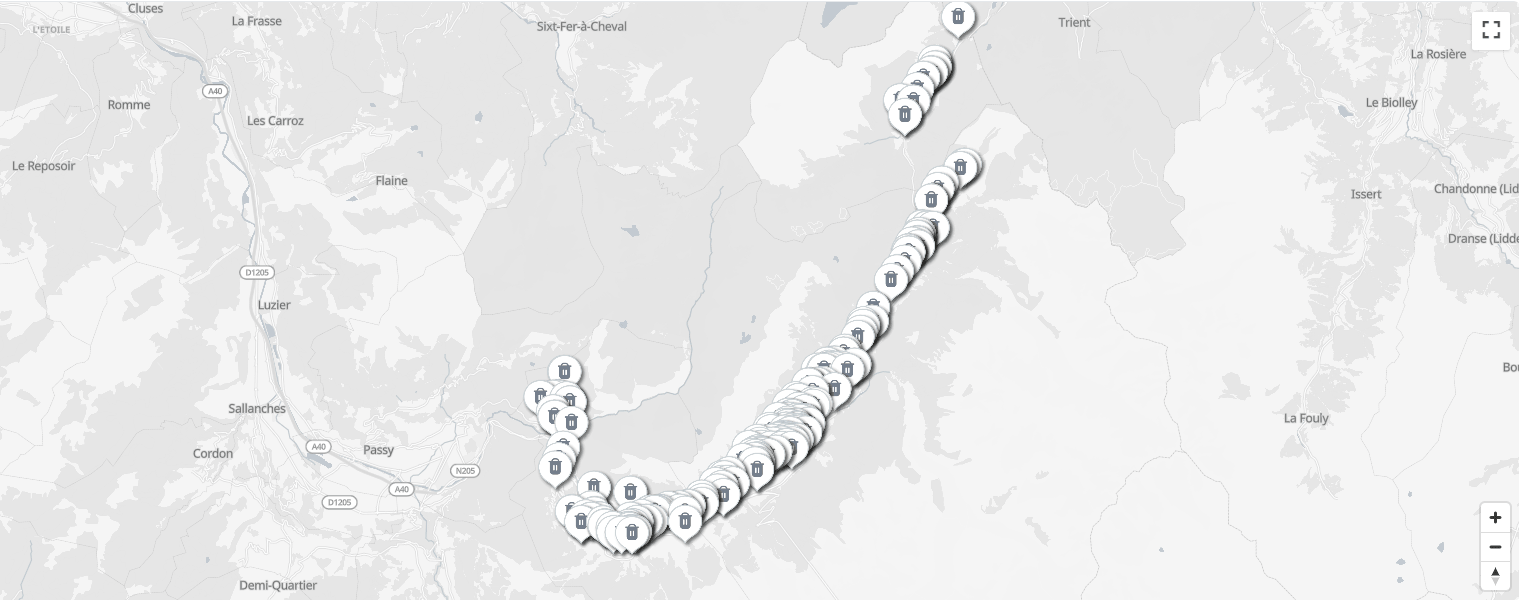
Map of the 170 drop-off points equipped across the 4 towns of the valley
A valley that changes size every six months
The Community of Communes of the Chamonix Mont-Blanc Valley brings together four towns: Chamonix, Les Houches, Servoz and Vallorcine. Permanent population: 14,200 residents. Tourist footfall: 8.5 million overnight stays in 2025.
Spread across the year, that’s an average of 23,000 extra people sleeping in the valley each night. And the peaks are anything but average: for major events such as the Ultra-Trail du Mont-Blanc in late August, footfall approaches 100,000 people, according to the Gendarmerie nationale. A collection service sized for 14,000 residents therefore has to absorb, without warning, a population multiplied by seven. To cope, the Régie fields a team of 12 people dedicated to collection.
On top of that comes an occasionally tricky geography. The area covers 217 km², and nearly 30 km separate the southernmost drop-off point, in Servoz, from the northernmost, in Vallorcine. Vallorcine closes the valley at the top: forty minutes’ drive up, forty back down, and a pass regularly shut for one to two months in winter.
Every trip up for a half-full container is nearly an hour and a half of truck time for nothing. At the other end, the heart of Chamonix imposes narrow lanes, dense traffic and pedestrians looking at Mont Blanc rather than the truck.
Key figure
In 2025, before optimisation, the service drove 151,381 kilometres, burned 98,446 litres of diesel across 1,716 collection rounds. That’s the baseline everything will be measured against by the end of 2027.
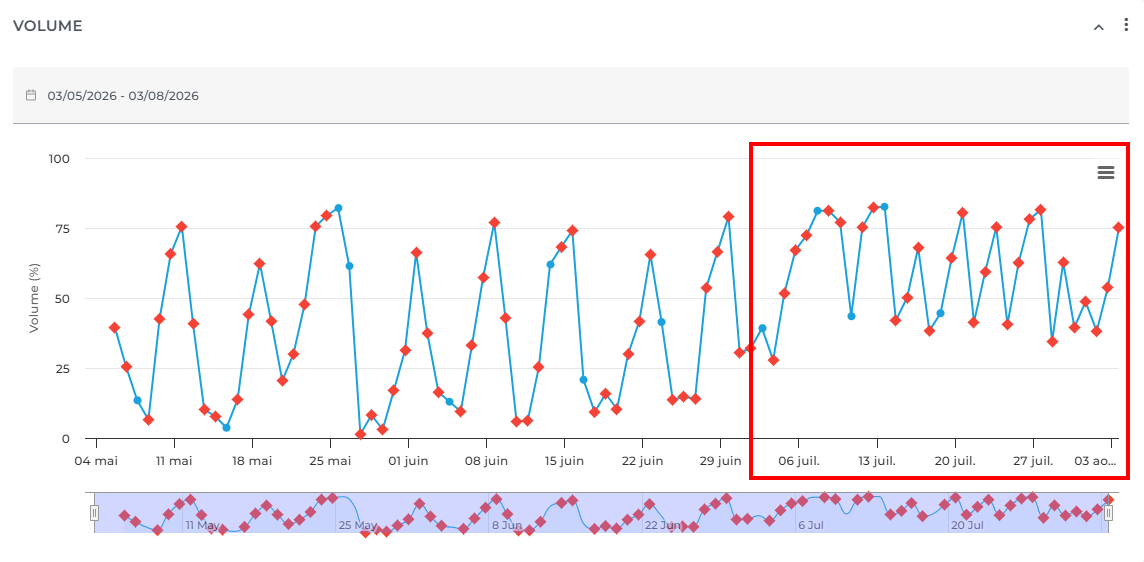
An increase in the pace of collection can be seen at one of the collection points in Houches – linked to the school holidays
Twenty years of scheduled collection rounds
The valley was one of the first French areas to install drop-off points, in the early 2000s. Then fifteen years without structural investment.
The collection calendar, for its part, hadn’t moved. Each point had its own inherited frequency, tweaked at the margins by drivers who knew their sector better than any spreadsheet. Real know-how, but invisible and non-transferable: it lived in the heads of a few agents.
In 2024, the Régie launched a full overhaul: renewing the container fleet, moving to mechanised lifting, fitting fill sensors on every container, and rolling out embedded operations software.
Note
An investment of €3.5 million, funded entirely from own funds, with no subsidy. The target is quantified: a 20% reduction in fuel and mileage by 2027.
- Each point emptied on a fixed rhythm
- Trips up to Vallorcine for half-full columns
- Real know-how, invisible and non-transferable
- No reliable record of the actual level before emptying
- Each container’s level known before the trip
- Collection at a configurable fill threshold (80%)
- The agents’ know-how made visible and measurable
- A figure-based baseline to steer and prove the gain
640 waste containers connected in eight weeks
The deployment ran from 13 April to 12 June 2026. Each NOVA RADAR sensor, a contactless radar fill sensor designed for collection containers, needs a mounting system to fix onto the container.
New containers arrive pre-drilled at the factory, ready to receive it. On containers already in place, you have to drill and adapt the fixing on site, which slightly lengthens the fitting time: allow about fifteen minutes per container when the mounting is ready, more when the container itself needs work. The sensor communicates over the low-power cellular networks LTE-M or NB-IoT, depending on the coverage available at each site.
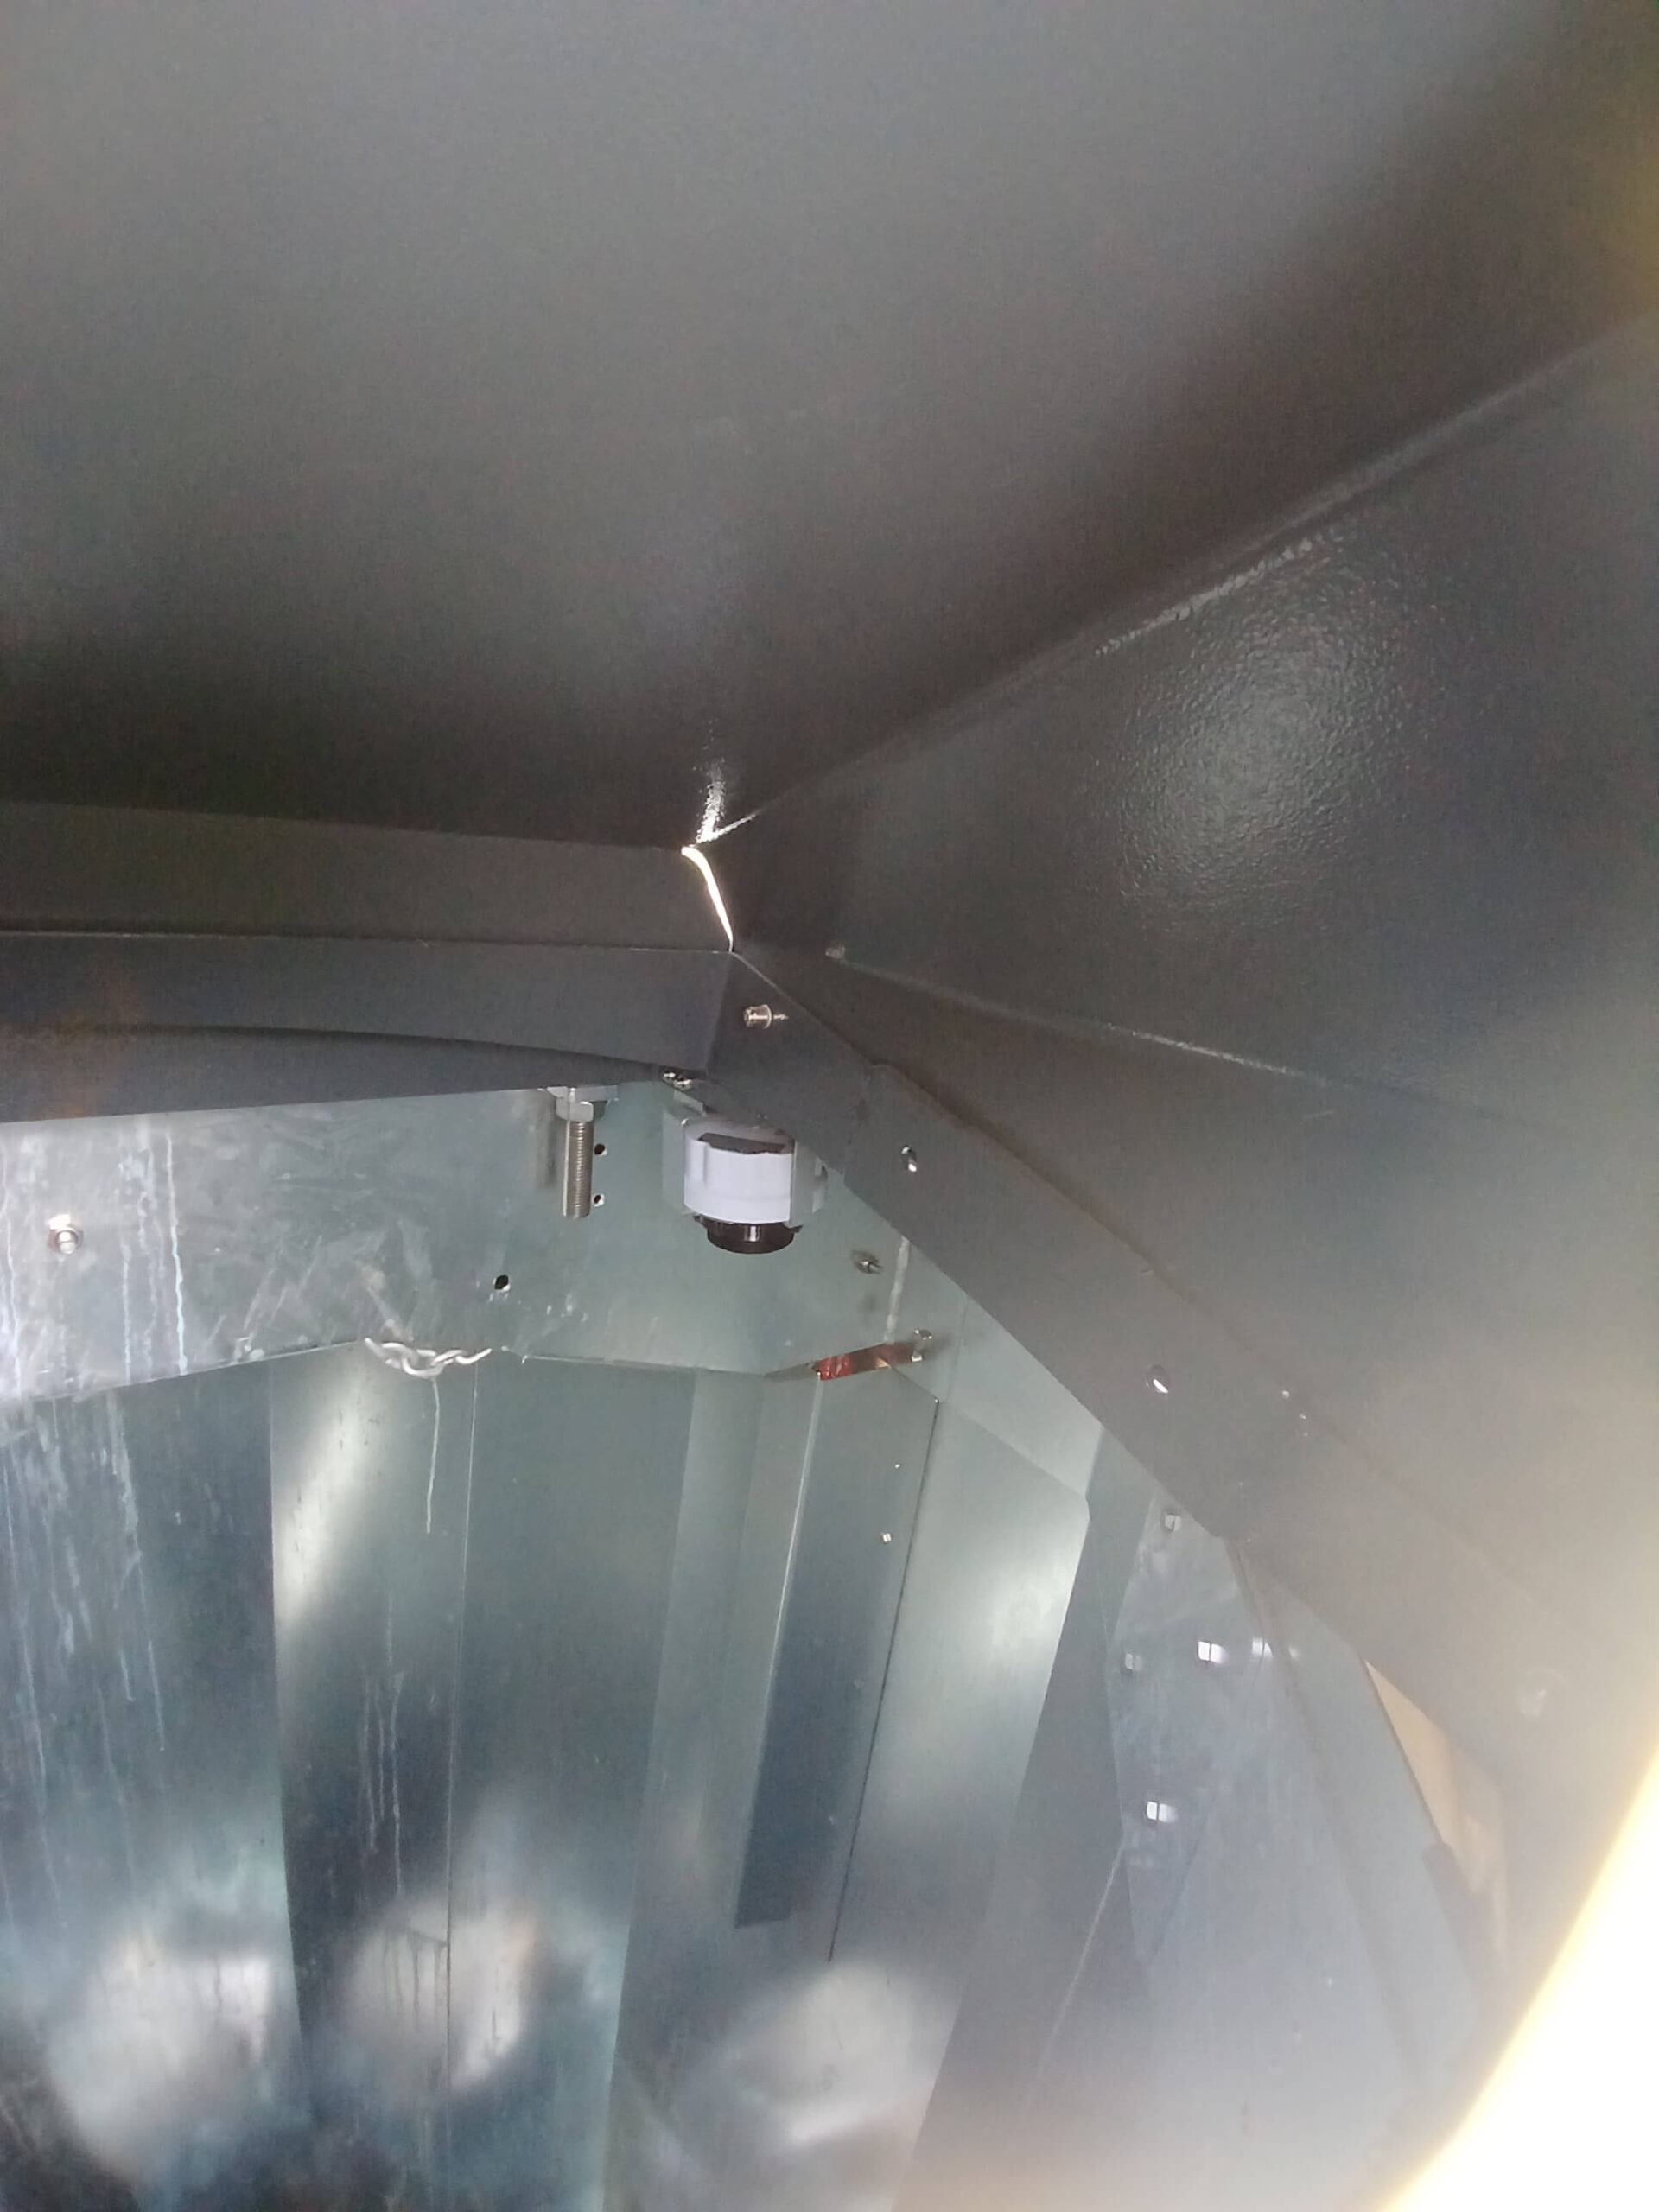
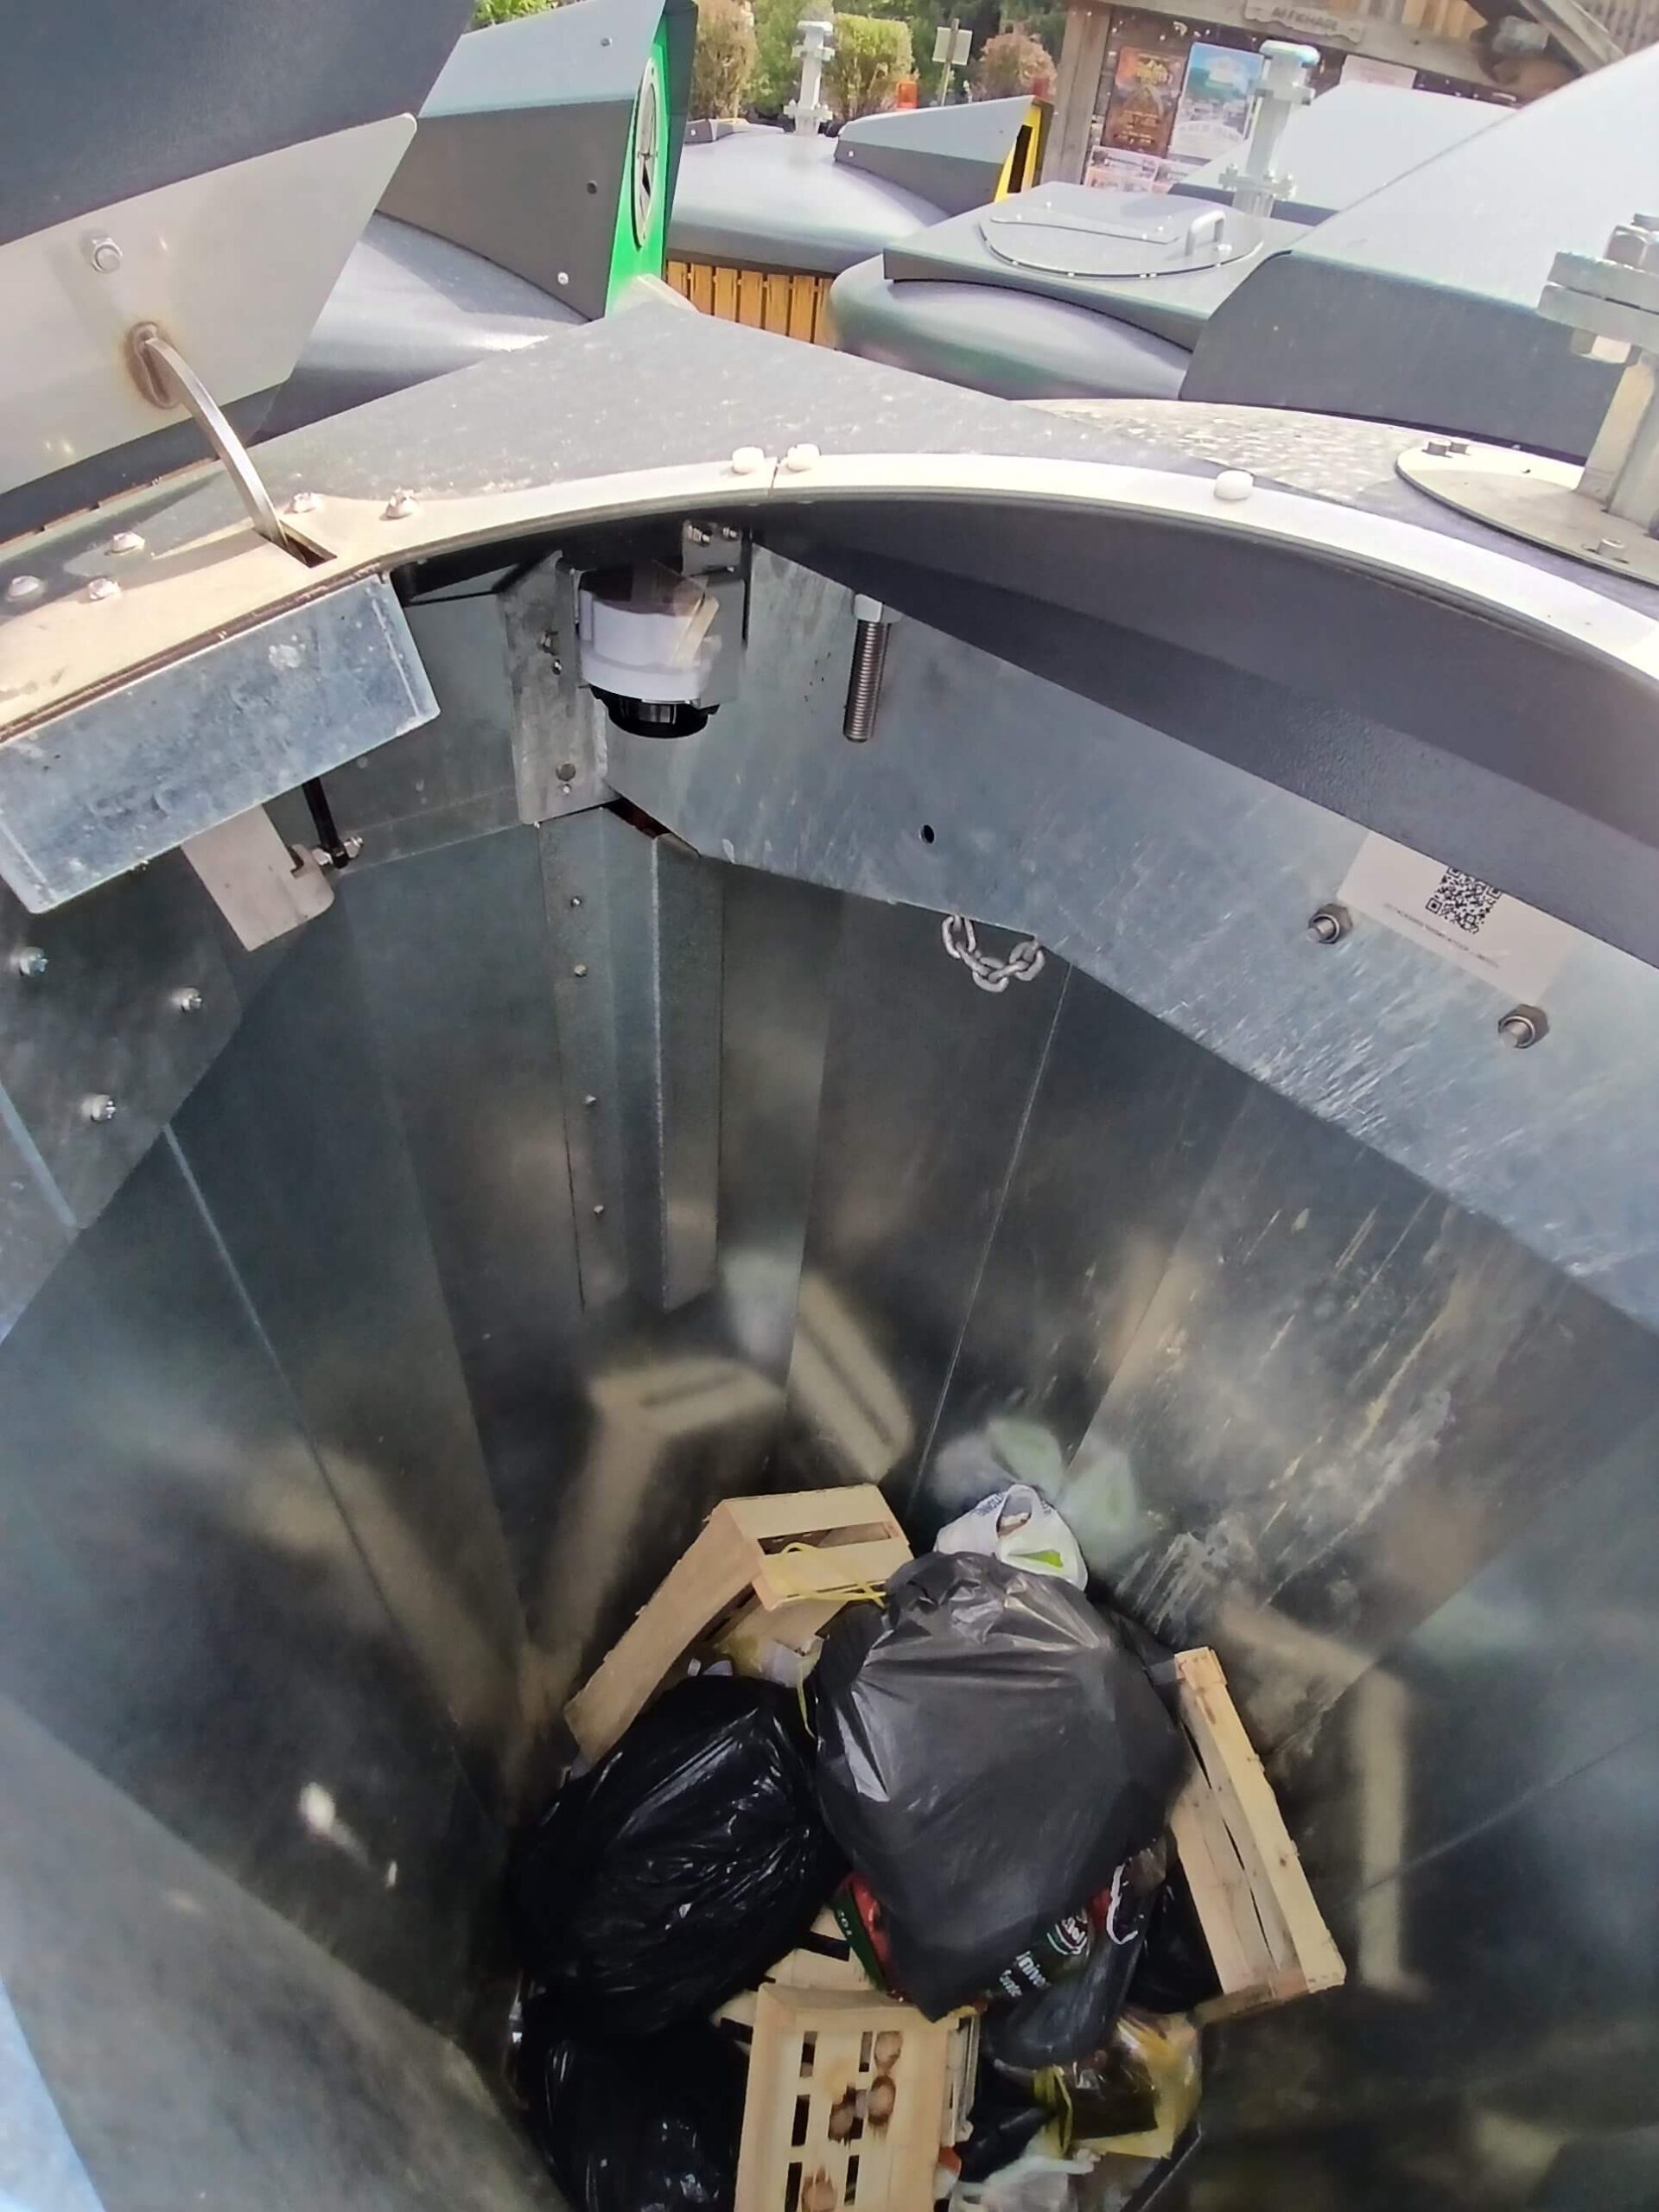
The architecture rests on two complementary building blocks. FOUR DATA supplies the fill sensors, the supervision platform and data hosting, in France. Mobil Inn brings iSmartCollect, the embedded software that runs on the in-cab tablets and turns the measured levels into collection rounds.
Attention
On a valley-bottom area, hemmed in by walls that block the signal, network coverage was the most uncertain parameter before starting. It was the figure that worried the team most: by 28 July, 98% of the fleet was communicating over the last 24 hours and 638 of 640 containers were operational.
Chamonix project architecture — FOUR DATA (sensors, platform, hosting) & Mobil Inn (embedded software)
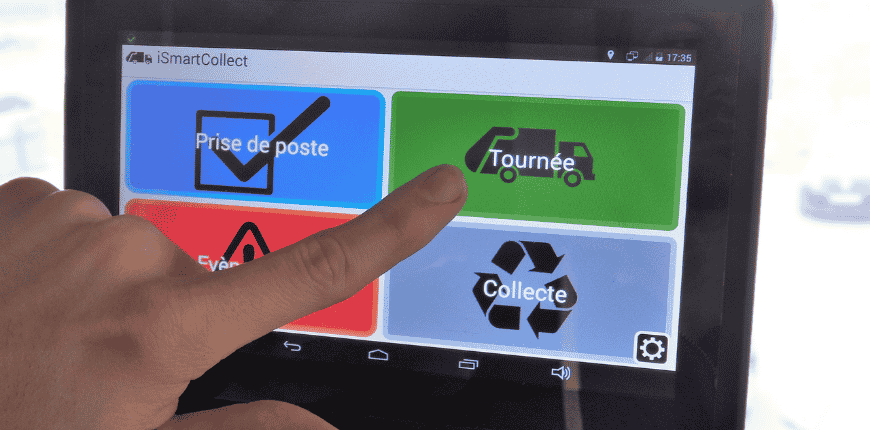
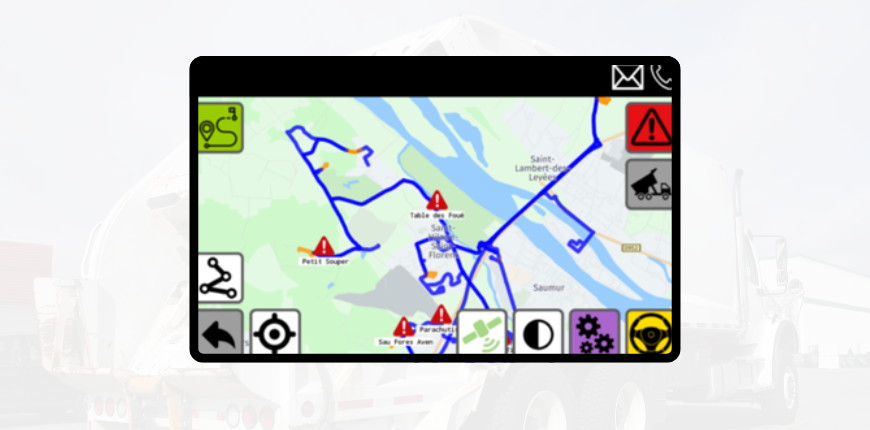
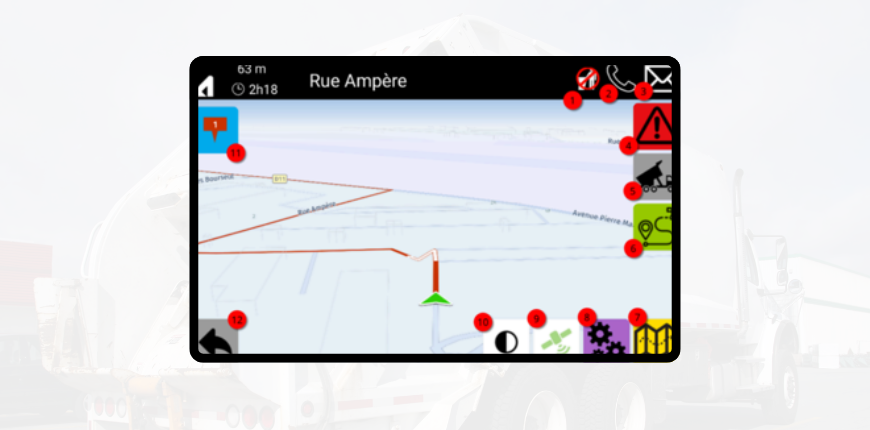
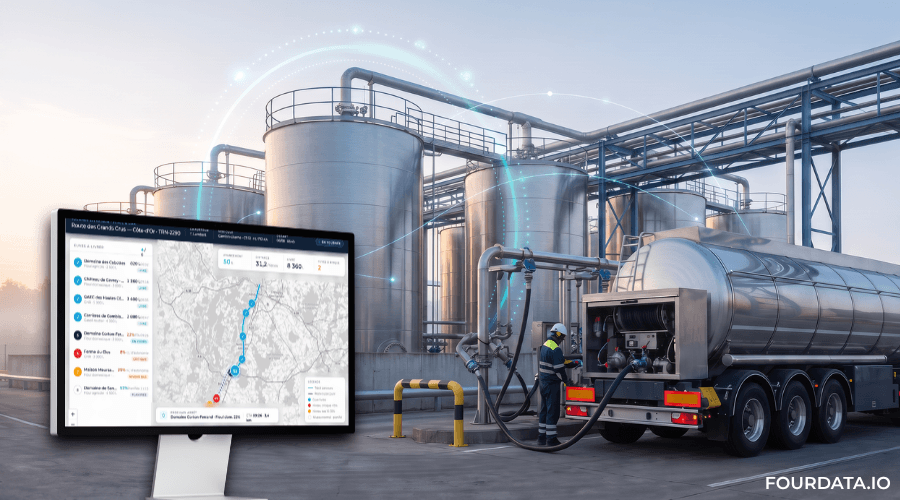
The iSmartCollect software (Mobil Inn) on the in-cab tablets turns measured levels into collection rounds
Expert advice
Before every deployment, we run a network coverage test on site to choose, container by container, between LTE-M and NB-IoT. On terrain that blocks the signal, this step determines the fleet’s communication rate — and therefore the reliability of the whole decision chain.
Deployment figures — Régie Intercommunale Chamonix Propreté, April–June 2026
The setup at a glance
| Sensor | NOVA RADAR (FOUR DATA), contactless radar measurement |
|---|---|
| Networks | LTE-M / NB-IoT depending on site coverage |
| Mounting | Support bar, no drilling on factory-ready containers |
| Fitting time | About 15 minutes per container |
| Collection threshold | 80%, configurable |
| Embedded software | iSmartCollect (Mobil Inn), in-cab tablets |
| Data hosting | France |
By 28 July, six weeks after the deployment ended, 638 of 640 containers were operational and 98% of the fleet was communicating over the last twenty-four hours. On a valley-bottom area, hemmed in by walls that cut the signal, it was the figure that worried the team most before starting.
The real obstacle wasn’t the mountain
This is where the project gets interesting, and it’s rarely what you read in a case study.
Fitting trucks with tablets and containers with sensors, to a collection team, looks a lot like surveillance. Guillaume Pheulpin, the Régie’s director, tackled the subject head-on from the outset, with exactly the opposite framing, notably with the teams concerned:
“Your way of working has been the same for twenty years. Thanks to the sensors and the software, we’re going to be able to demonstrate that your method is right. A service of this quality couldn’t have lasted twenty years if your work hadn’t been up to standard. Above all, the tool recognises the work the teams were already doing, then helps us find room to optimise. It’s a genuine learning tool..”
— Guillaume Pheulpin, director of the Régie Intercommunale Chamonix Propreté
The tool doesn’t come to correct the agents. It comes to make visible what they were already doing.
Then he went further. Rather than asking the 12 collection agents to trust an electronic measurement, he asked them to check it. The sensor says 60%, the agent opens the lid and looks. This step, in no specification, settled the question of hardware reliability before optimisation was even on the table. A sensor you’ve checked yourself is no longer a snitch, it’s an instrument.
Without that groundwork, the tool would have been neutralised in a week. A tablet nobody wants to use goes offline very fast, and no one can blame the software.
“You can put the keys to a Porsche in a driver’s hands — if he doesn’t want to, he won’t do it.”
— Guillaume Pheulpin, director of the Régie
Frequent mistake
Presenting the sensors as a tool to monitor agents. Experienced as a snitch, the system is neutralised within days. In Chamonix, the reverse framing — validate the existing work, then have the teams check the measurements themselves — was the real condition for success, more than the technology.
The frustration nobody had anticipated
It didn’t come from where it was expected. The point of friction wasn’t being measured. It was having to give up.
Driving past a drop-off point, seeing it’s below the threshold, and not being allowed to empty it — when twenty years of the job say otherwise. “Yes, but I do it on Monday because I know that by Wednesday I won’t have time and by Thursday it’ll overflow.”
That reasoning isn’t a bad habit. It’s experience, built precisely because no tool let you know. The project’s difficulty isn’t learning to read data, it’s unlearning a heuristic that worked well for two decades. It takes time, and it takes explaining why. It’s probably the most underestimated cost item in this kind of deployment.
A benefit that was in no specification
Summer 2025. An agent parks alongside a drop-off point set into a hedge. He slips between the hedge and the truck, invisible from the road, and falls into a manhole. He gets out on his own, because he’s tall and the fall wasn’t deep. With a different build, or a deeper shaft, the story could have ended differently.
But the system now knows how long each point takes. Seven minutes on average on that one. After fifteen, something’s wrong. Anomaly detection on presence times becomes a lone-worker protection device, with no extra sensor and no individual monitoring: it isn’t the agent being tracked, it’s a duration that falls outside the norm.
Same logic for a blackout in the cab or an altercation with a user. On an area where drivers break a wing mirror a week at peak season, and where some quit the job over road risk, cutting the number of trips isn’t just a diesel saving. It’s a reduction in exposure for the team.
A tool that learns seasonality, then flags the unexpected
On a tourist area, seasonality is largely predictable. School holidays don’t move, big sporting events fall on the same dates, concerts are announced six months ahead. The first year of operation is therefore spent learning this cycle: the sensors document, sector by sector, how the fleet fills up by season and footfall.
It’s once that cycle is learned that the tool takes on its second dimension. A fleet whose normal behaviour is known becomes one where the abnormal shows immediately: exceptional footfall absent from the calendar, a container suddenly filling faster than usual, a gradual drift on a sector. Events no plan can anticipate, and that the measurement flags the moment they happen.
Guillaume Pheulpin sums up the path in three stages: learn first, consolidate next, then lean durably on the tool to track the fleet and absorb the unexpected.
| Phase | Sensor’s role | What it produces |
|---|---|---|
| Year 1 | Learning | The fleet’s seasonal cycle, sector by sector |
| Year 2 | Consolidation | Firming up the route model |
| Year 3 and beyond | Detection | Unexpected events, drifts, fleet rebalancing |
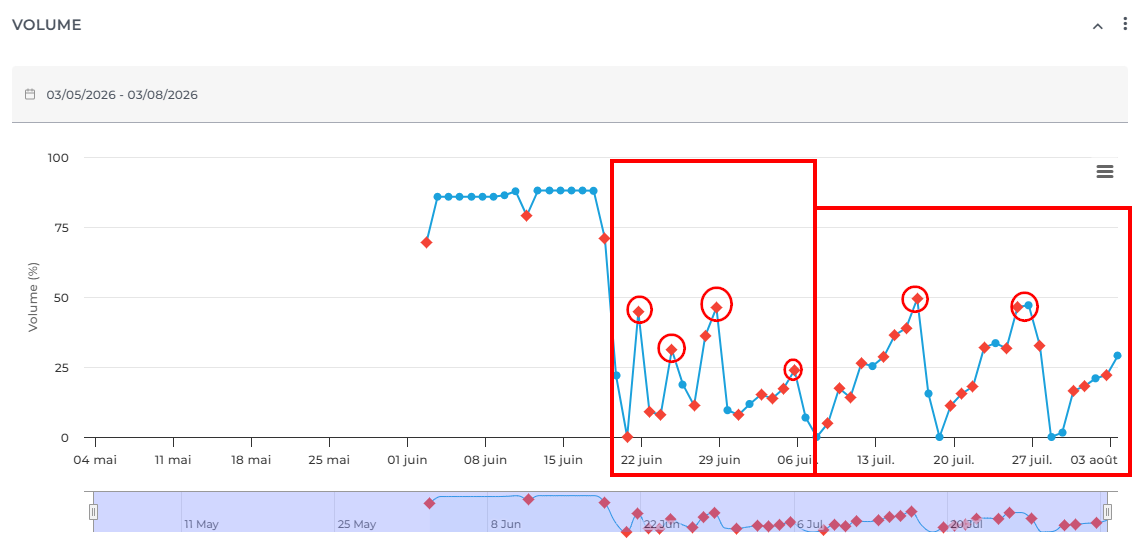
A concrete example of this third phase: a container filling ten times faster than its neighbours signals a siting imbalance. You add one next to it, and stop driving up into a whole sector for a single saturated point. The sensor no longer just decides today’s round, it redraws the fleet.
The first variations are already visible. On one drop-off point in the town of Chamonix, 4 trips in 2 weeks, versus 2 trips over 4 weeks just after — a 50% cut in trips.
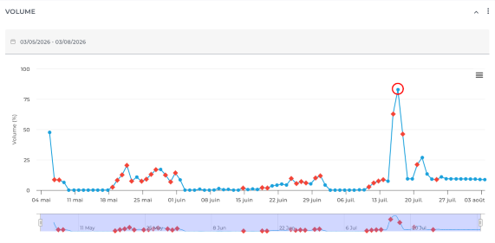
Anomaly detection: an alert can be configured as soon as a point exceeds a variation threshold over a defined period
From route optimisation to sorting education
Beyond logistics, the gauges play a second role: supporting change management and giving the Régie a new, more educational stance with residents and elected officials alike.
“You’ve got a drop-off point among 250 residents, the same one among 250 other residents, and they don’t have the same habits. One neighbourhood will produce 500 kg of waste and the other 200. Understanding that gap might mean running working groups on best practice.”
— Guillaume Pheulpin, director of the Régie
Fill data, sector by sector, becomes an instrument of public policy. It says where sorting works and where it progresses more slowly, at a granularity no declarative survey will reach. It also reframes an injunction every Régie director knows:
“My elected officials tell me to reduce the volume of waste. I tell them I’ll never reduce it, I’m not able to, I’m passive: I receive the waste. The producers are your residents.”
— Guillaume Pheulpin, director of the Régie
A collection service doesn’t reduce volumes, it records them. But it can now say precisely where to focus prevention, and document its exchanges with officials and residents alike. The Régie changes role: it no longer just collects, it informs the area’s decisions.
What to remember if you manage a comparable area
The technical deployment is the easy part. Eight weeks for 640 containers, 99.7% of the fleet operational, on a 217 km² area where 30 km separate the two ends of the fleet. That’s not where the project’s success is decided.
Plan a dedicated resource for operations. Data nobody opens produces no gain. On a small Régie, the time freed by the first optimisations is exactly what funds this role. On a larger authority, you need a lead from day one.
Framing with the teams conditions everything else. Presenting the tool as validation of the existing work, then having the agents check the measurements themselves: two decisions that cost nothing and without which nothing works.
Establish your baseline before you start. Mileage, fuel, collection hours, number of rounds. Without those figures, you can’t demonstrate the gain, even if it’s real. The Chamonix Régie rebuilt its own baseline for 2025 so it can compare at the end of 2027.
Advantage at a glance
Steering by real need rather than by the calendar — fewer kilometres and less diesel, reduced exposure for the teams, and data that informs the area’s decisions, without degrading the service.
What next?
The project is entering its learning phase, where teams, tool and area learn to work together. Rounds adjust week by week, habits consolidate, and the data starts to tell the valley’s story.
The Chamonix Propreté Régie now has everything it needs to see its approach through: an operational fleet of connected drop-off points, teams that have taken ownership of the tool, and a method that made change management a strength of the project rather than an obstacle.
What comes next is written in the field: refining rounds season after season, opening the sorting-education work, and making data a common language between the Régie, elected officials and residents. In Chamonix, collection is no longer run by the calendar, it’s run by real need. And it’s a whole valley that gains from it.
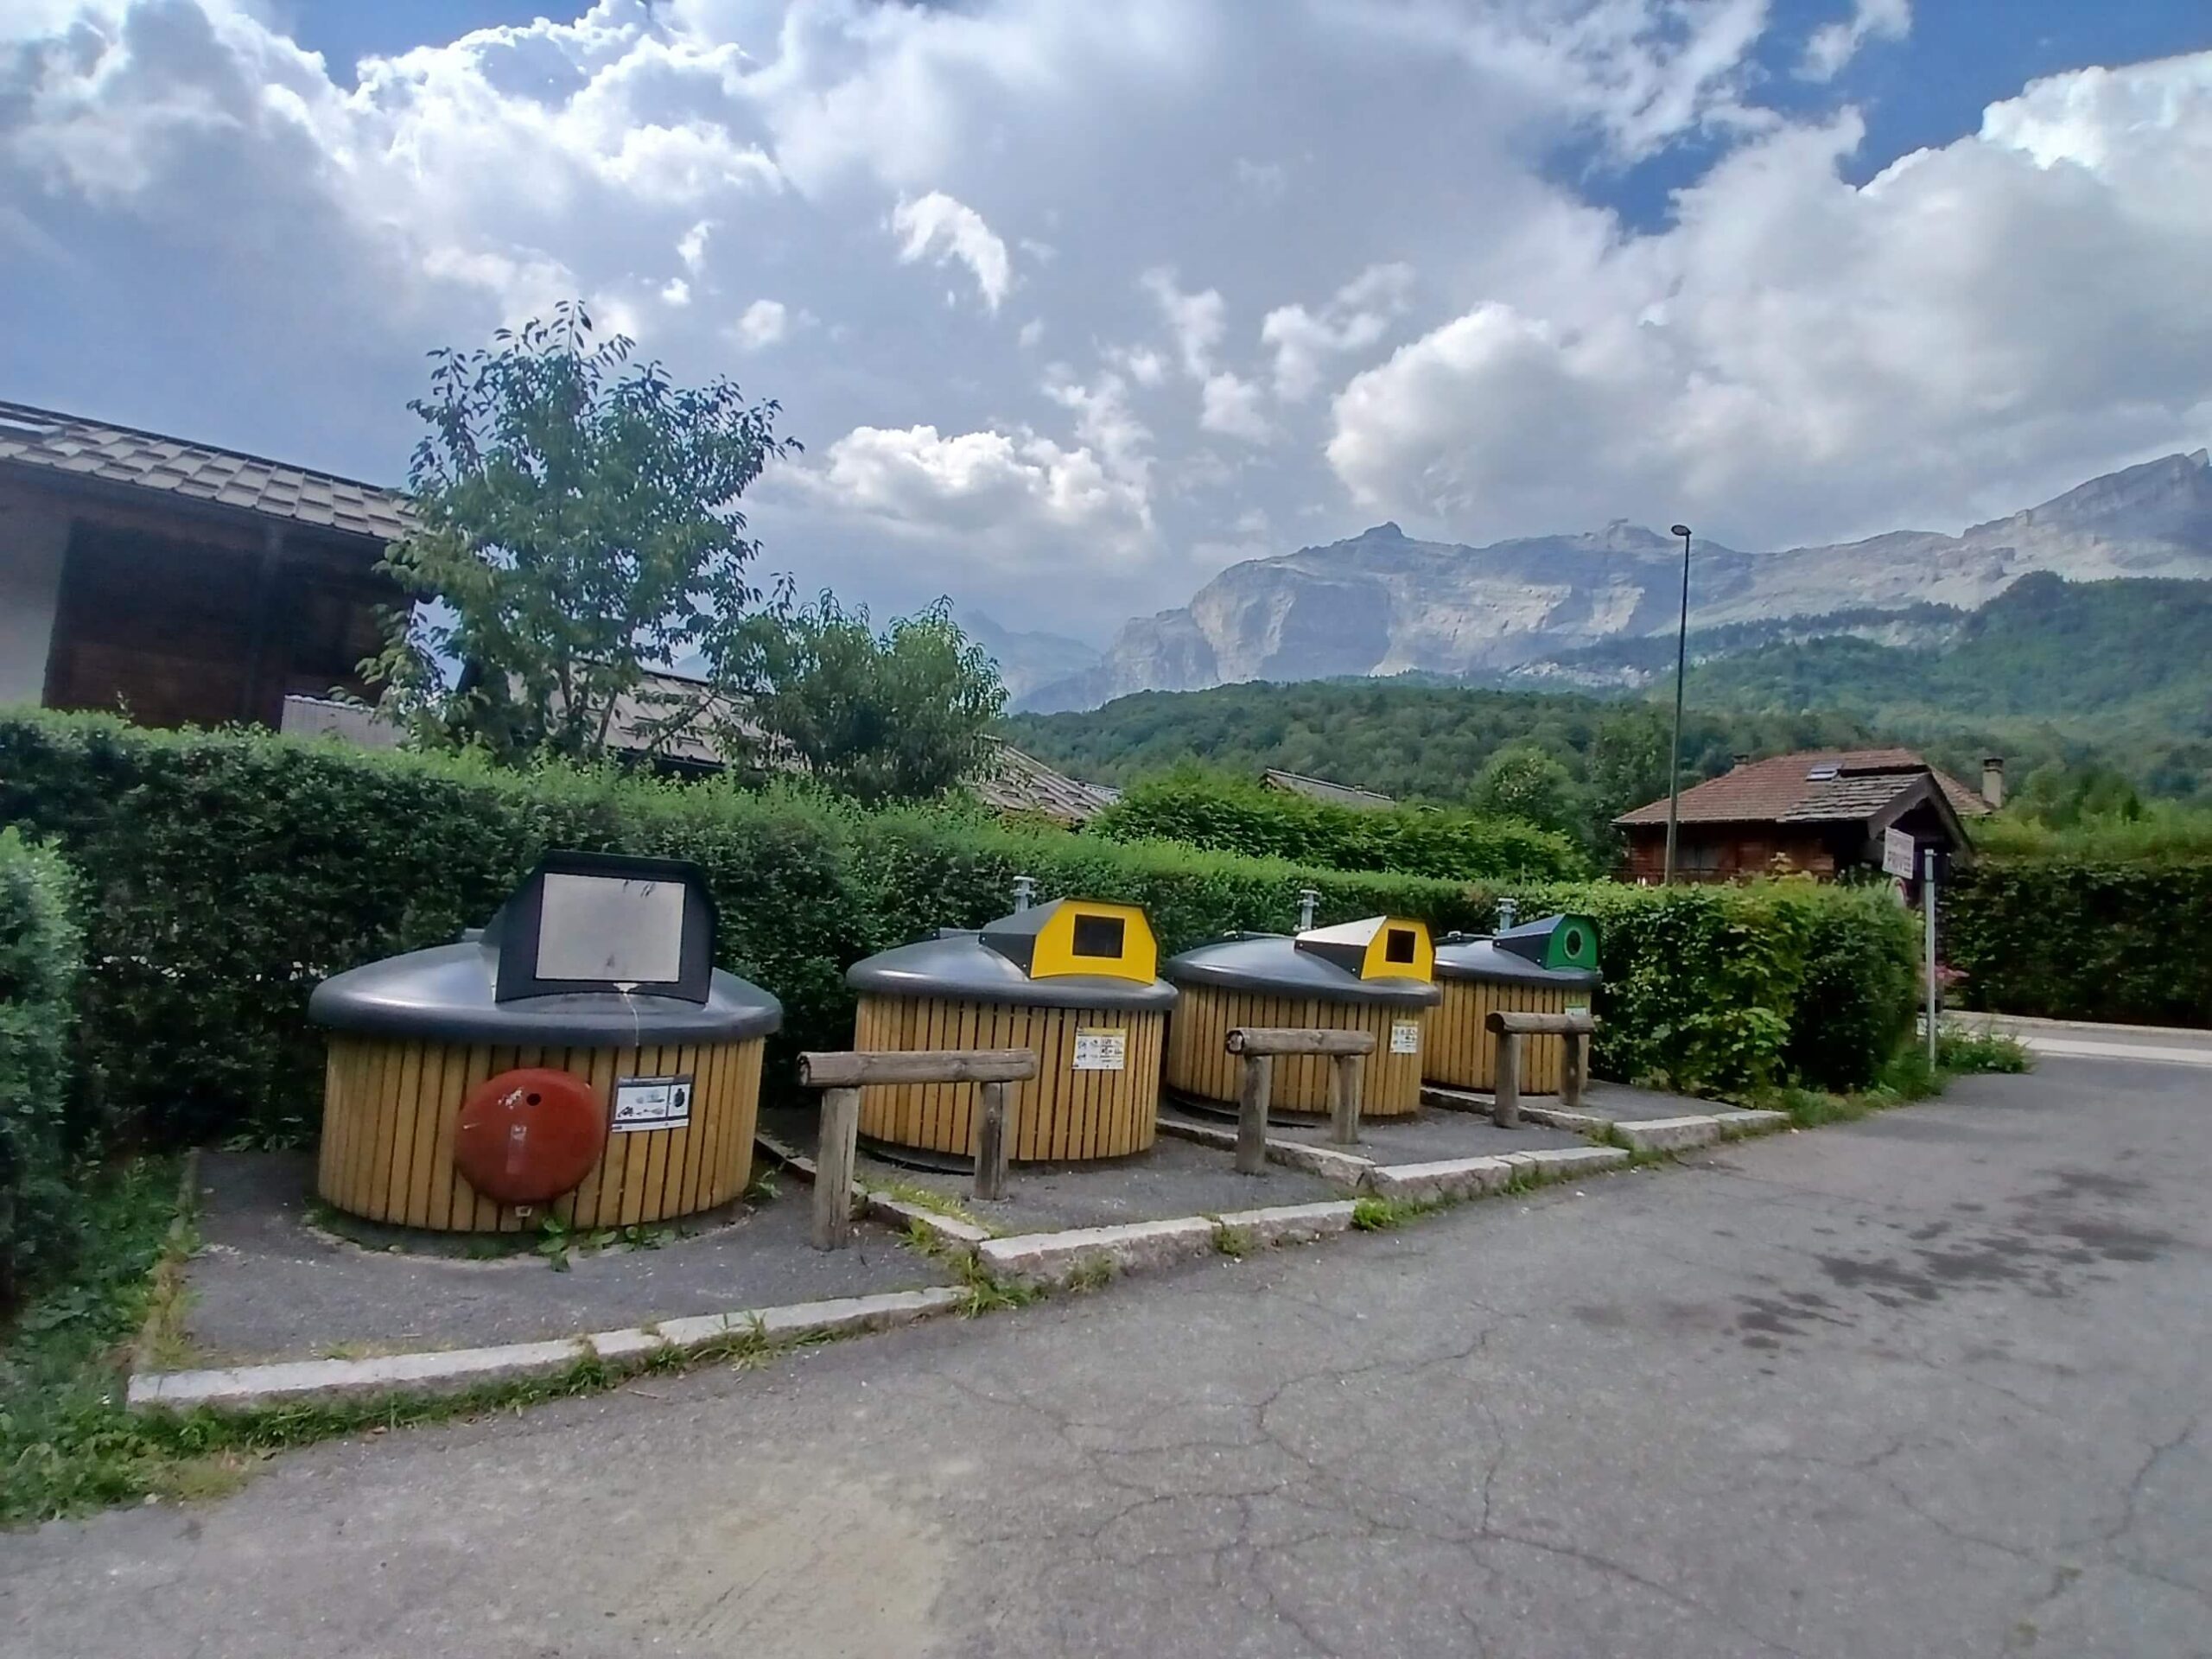
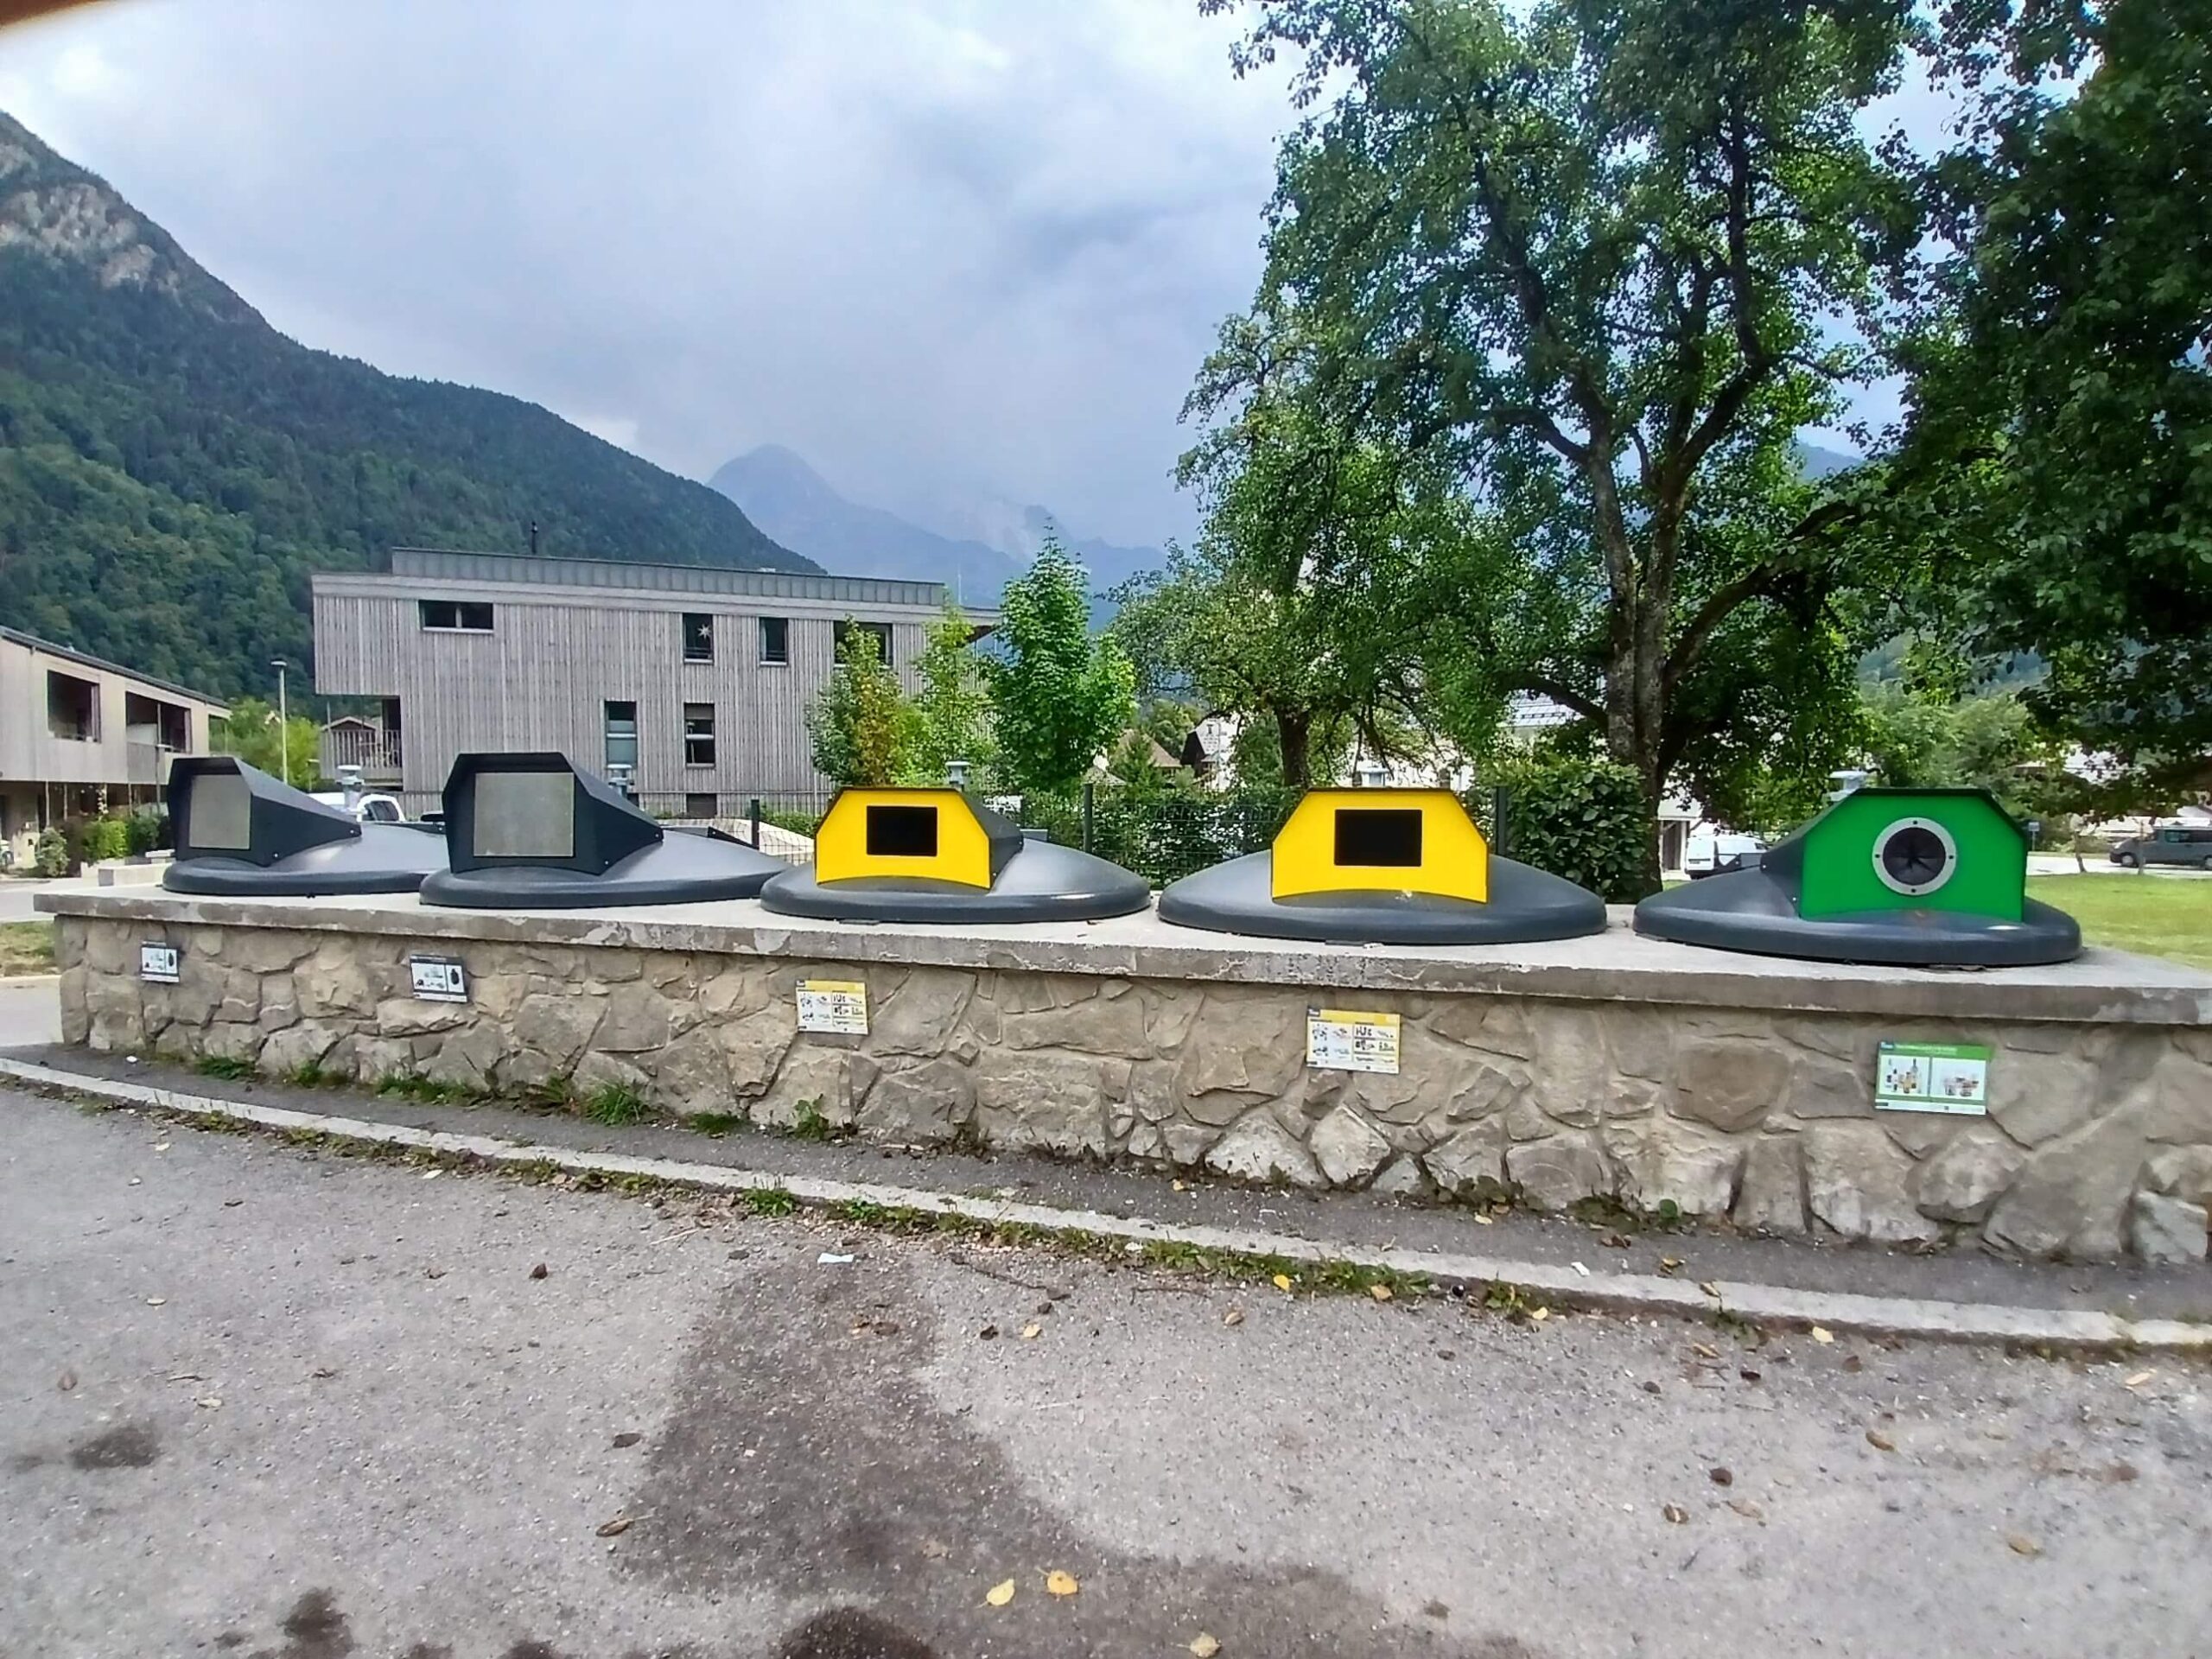
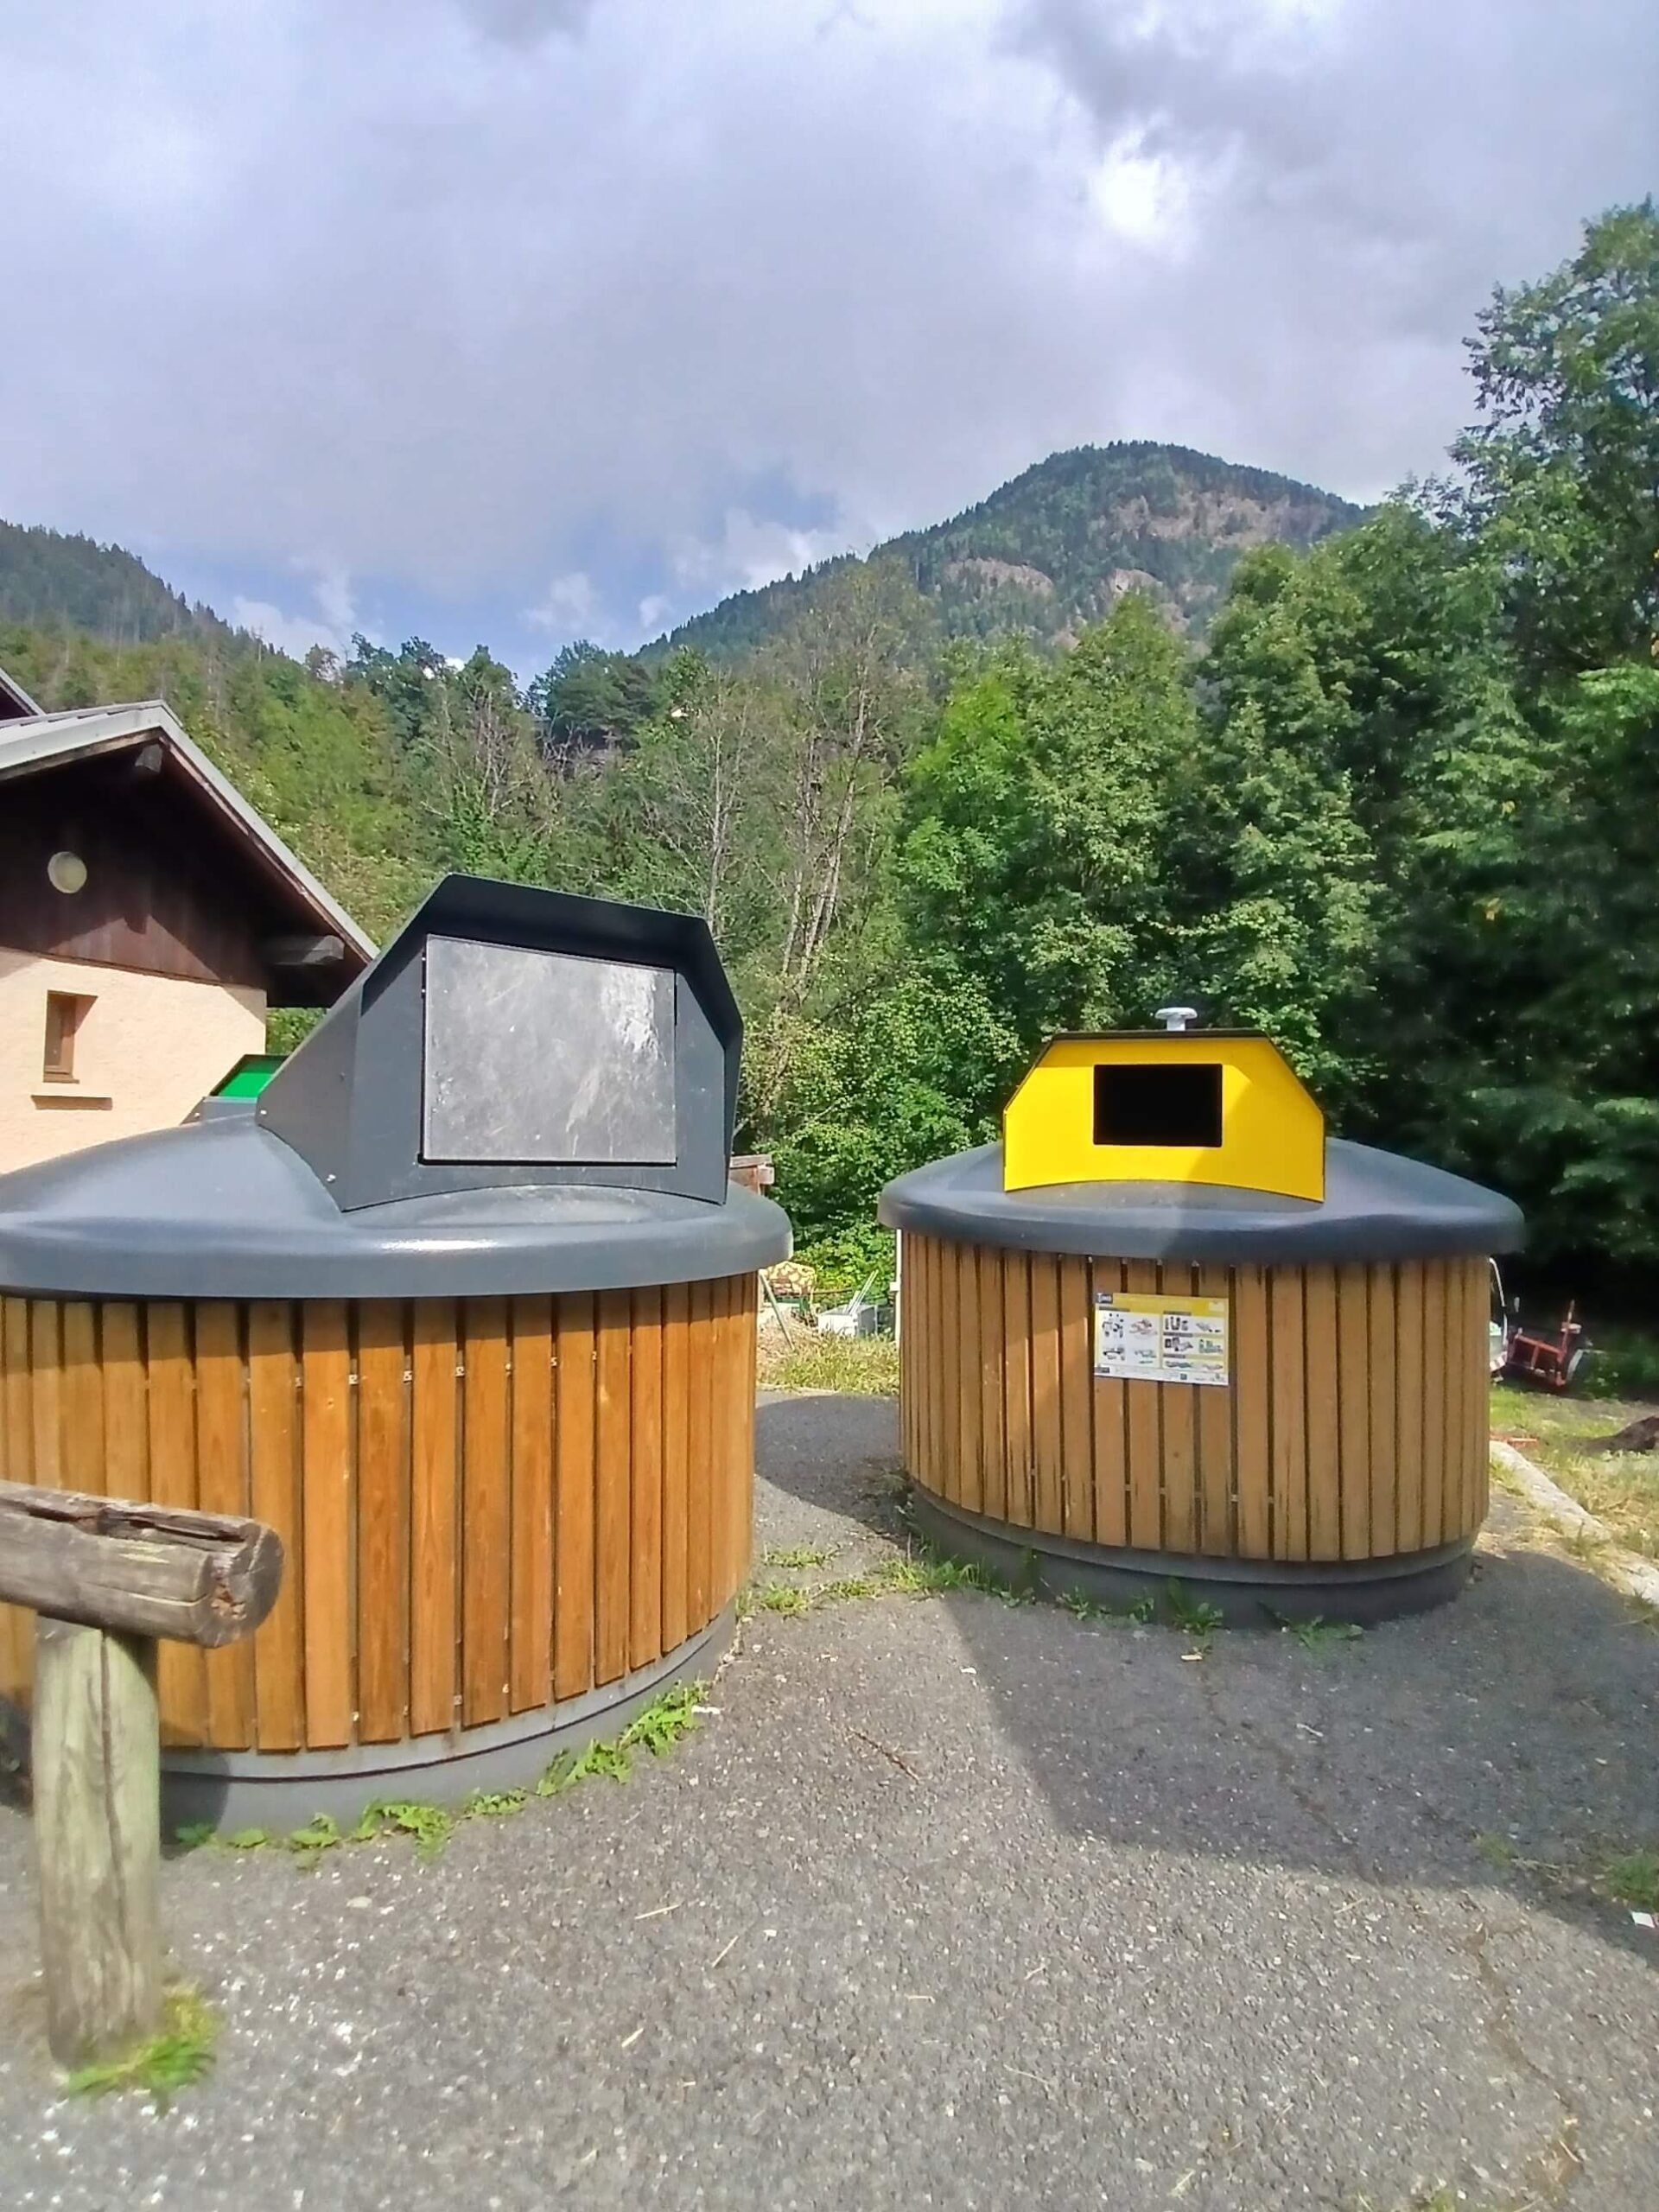
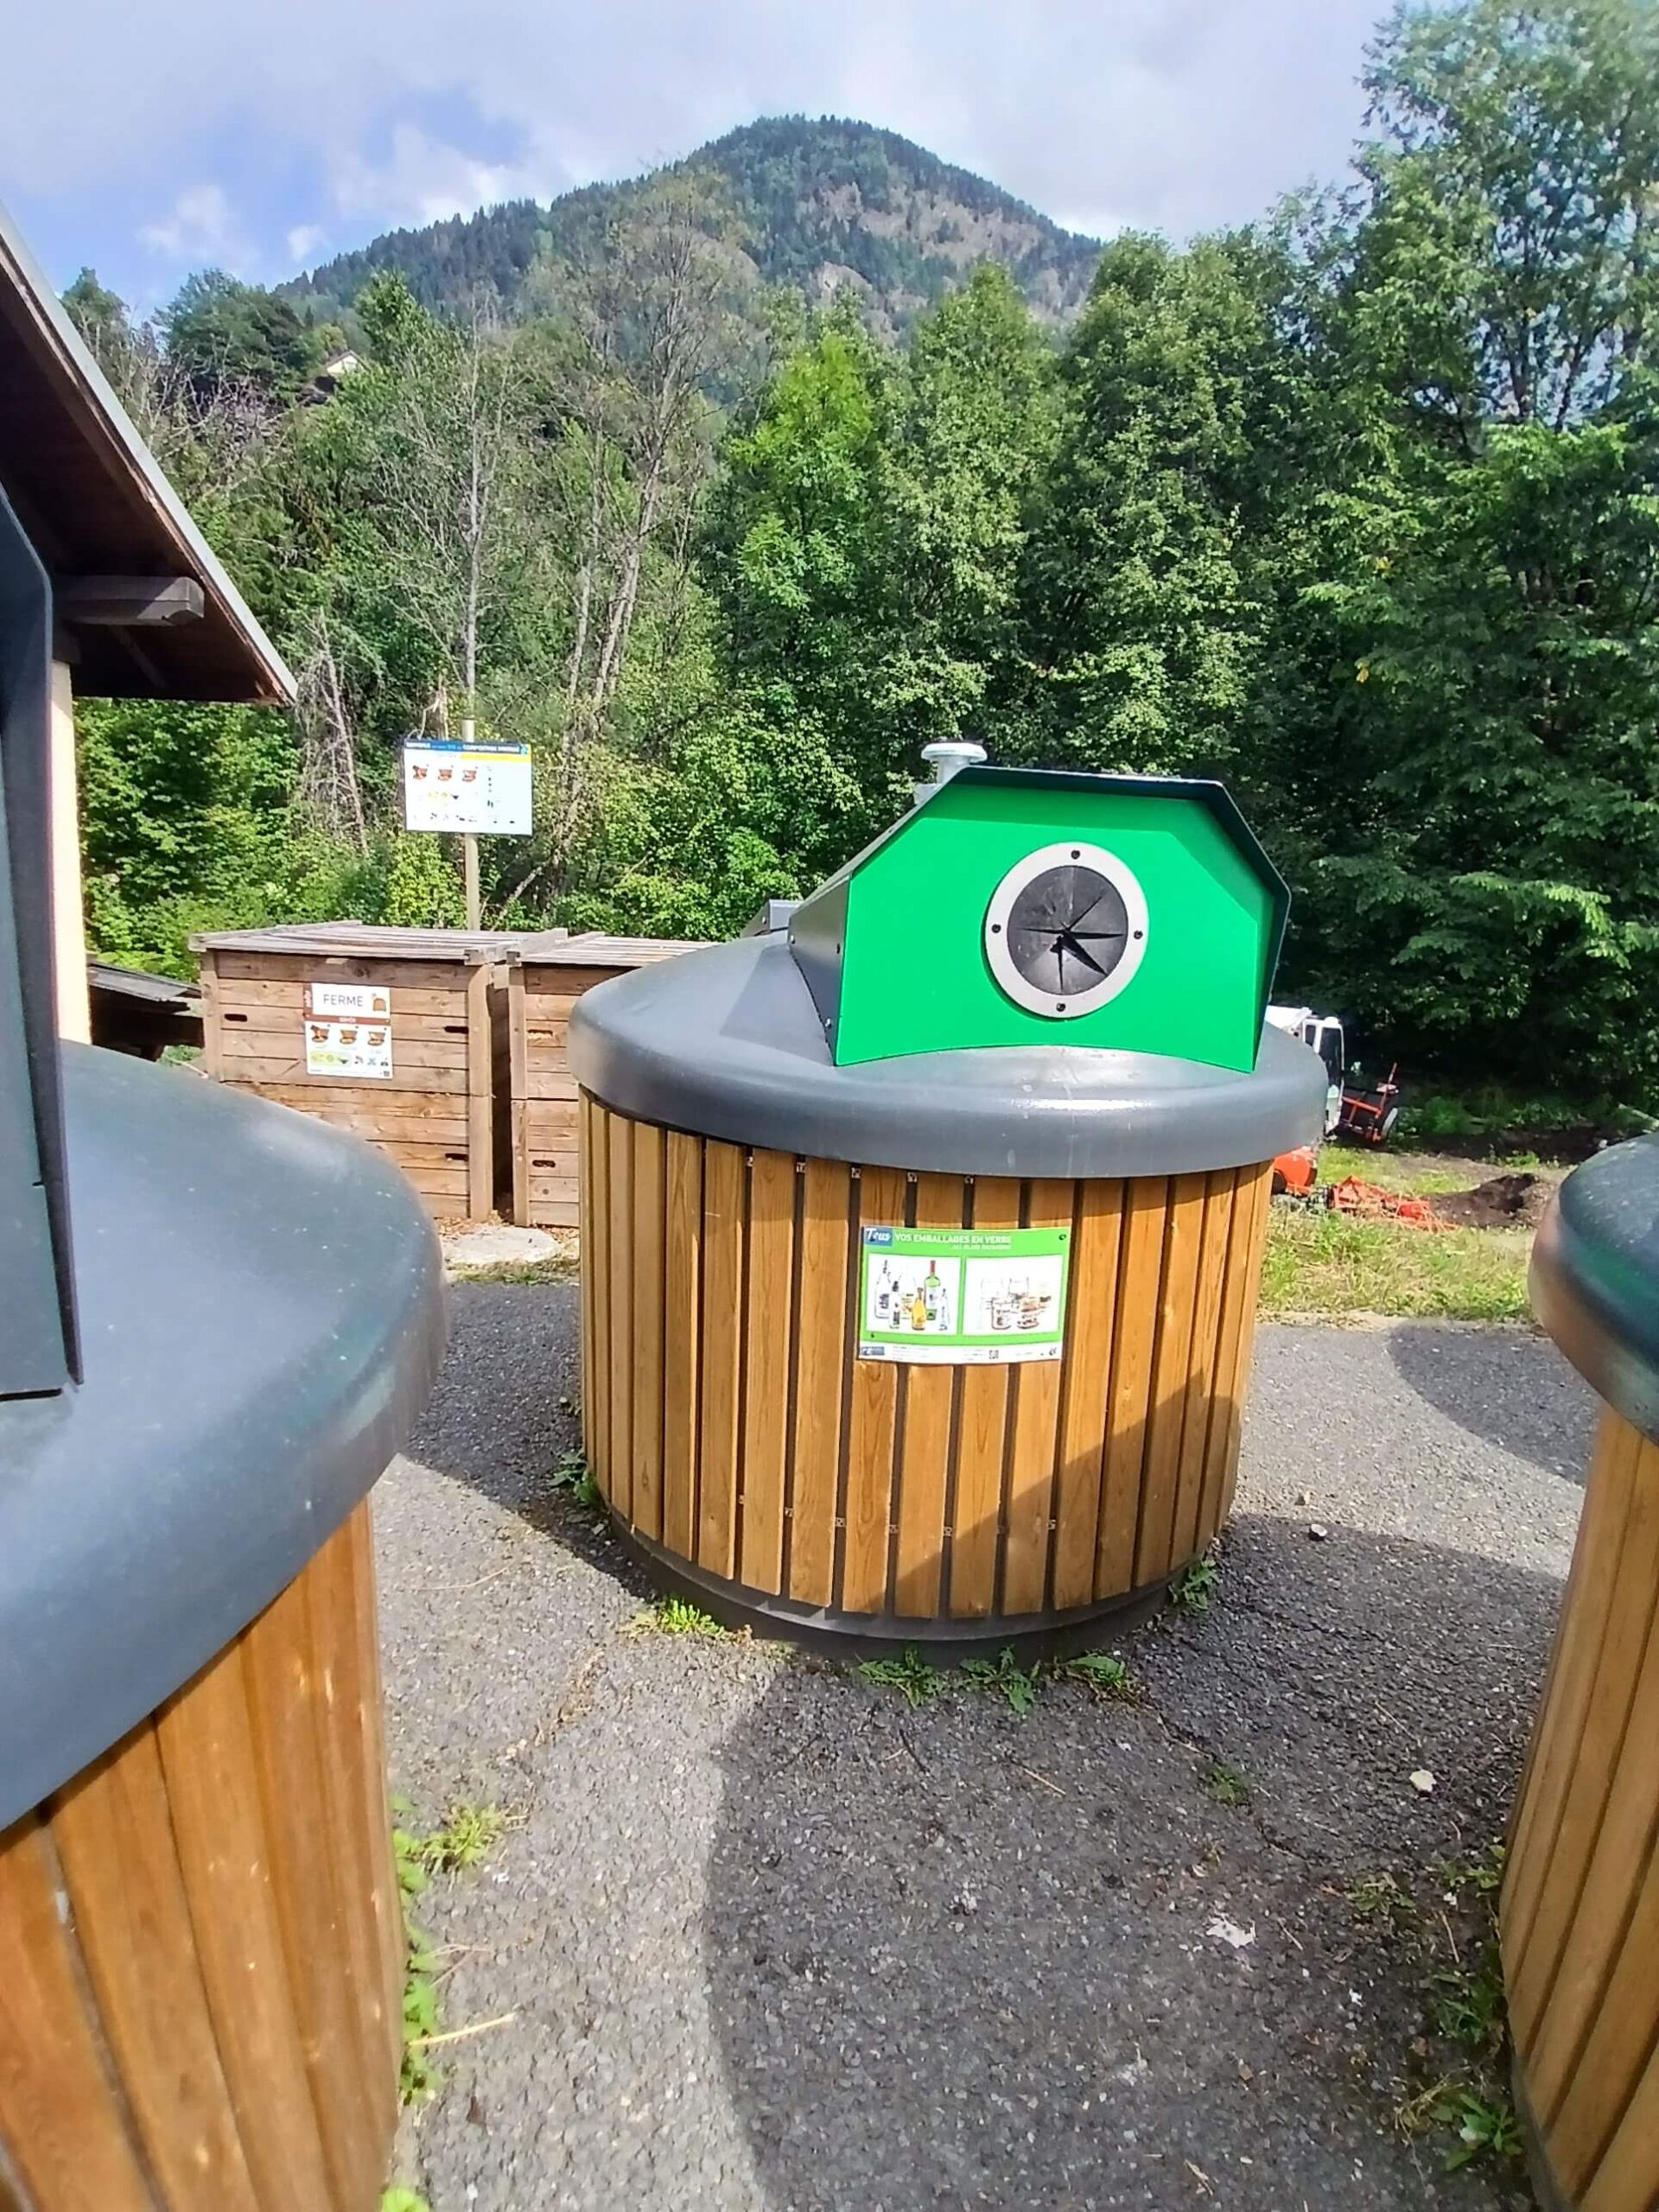
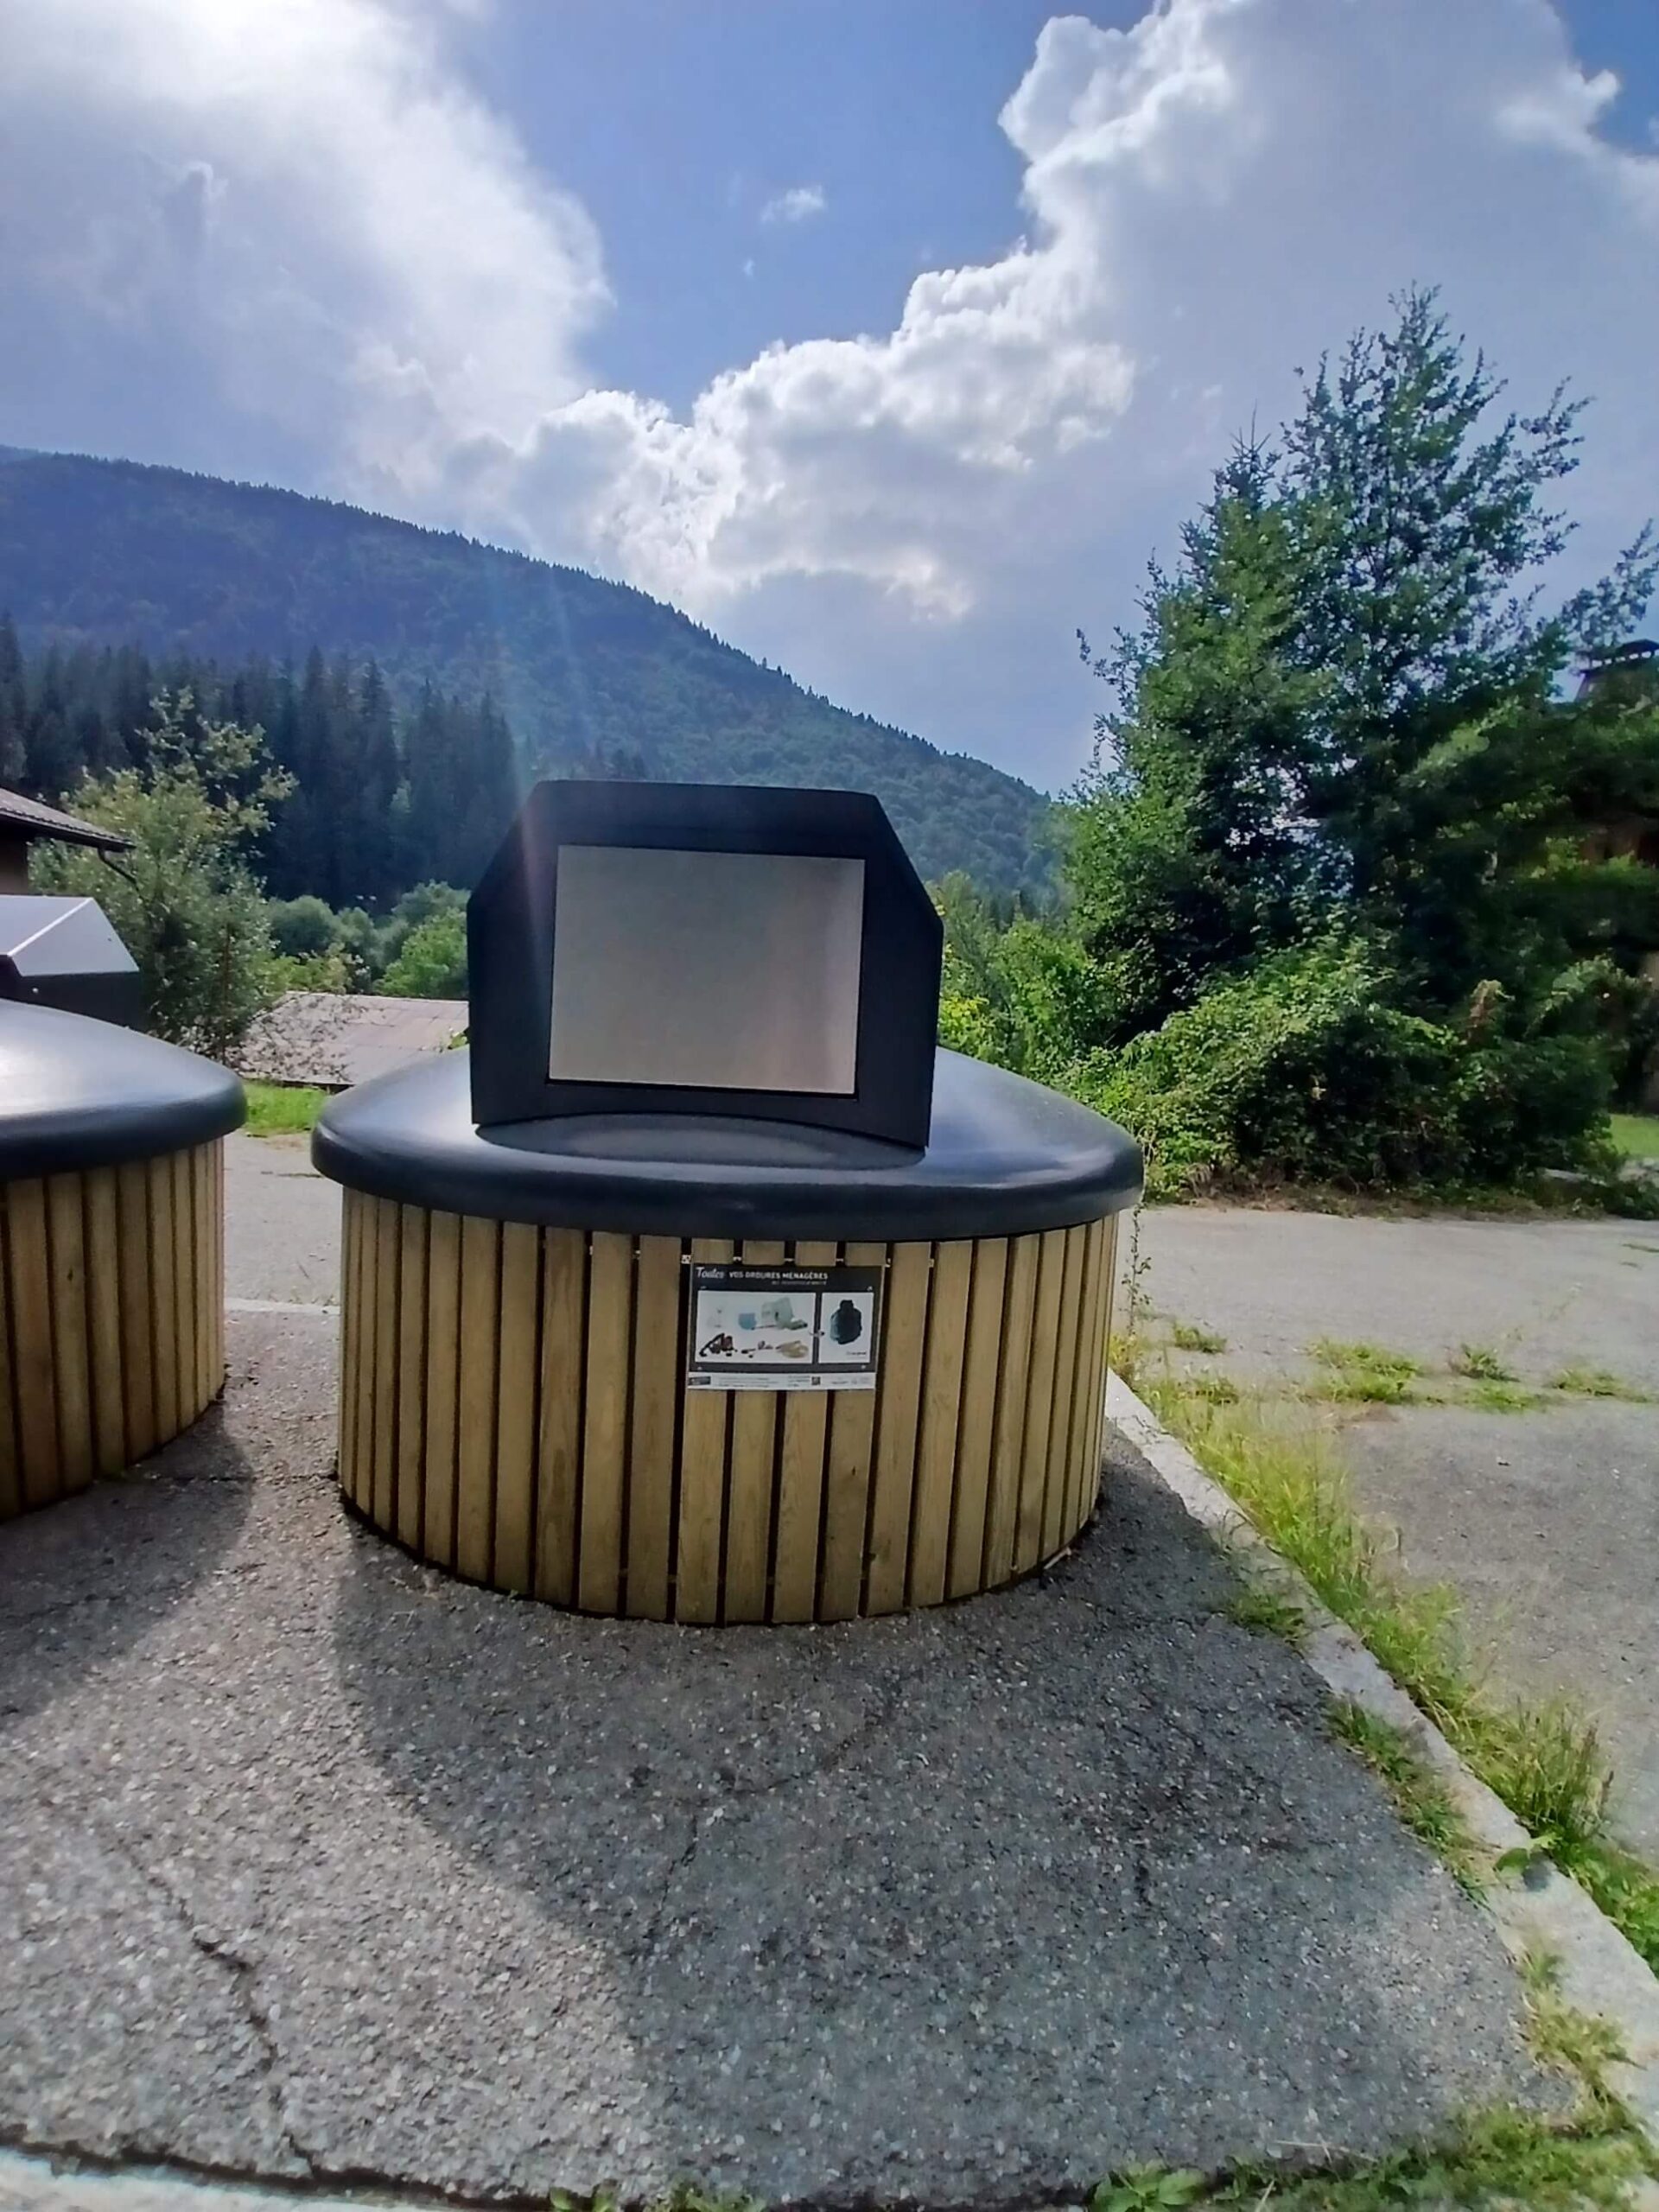
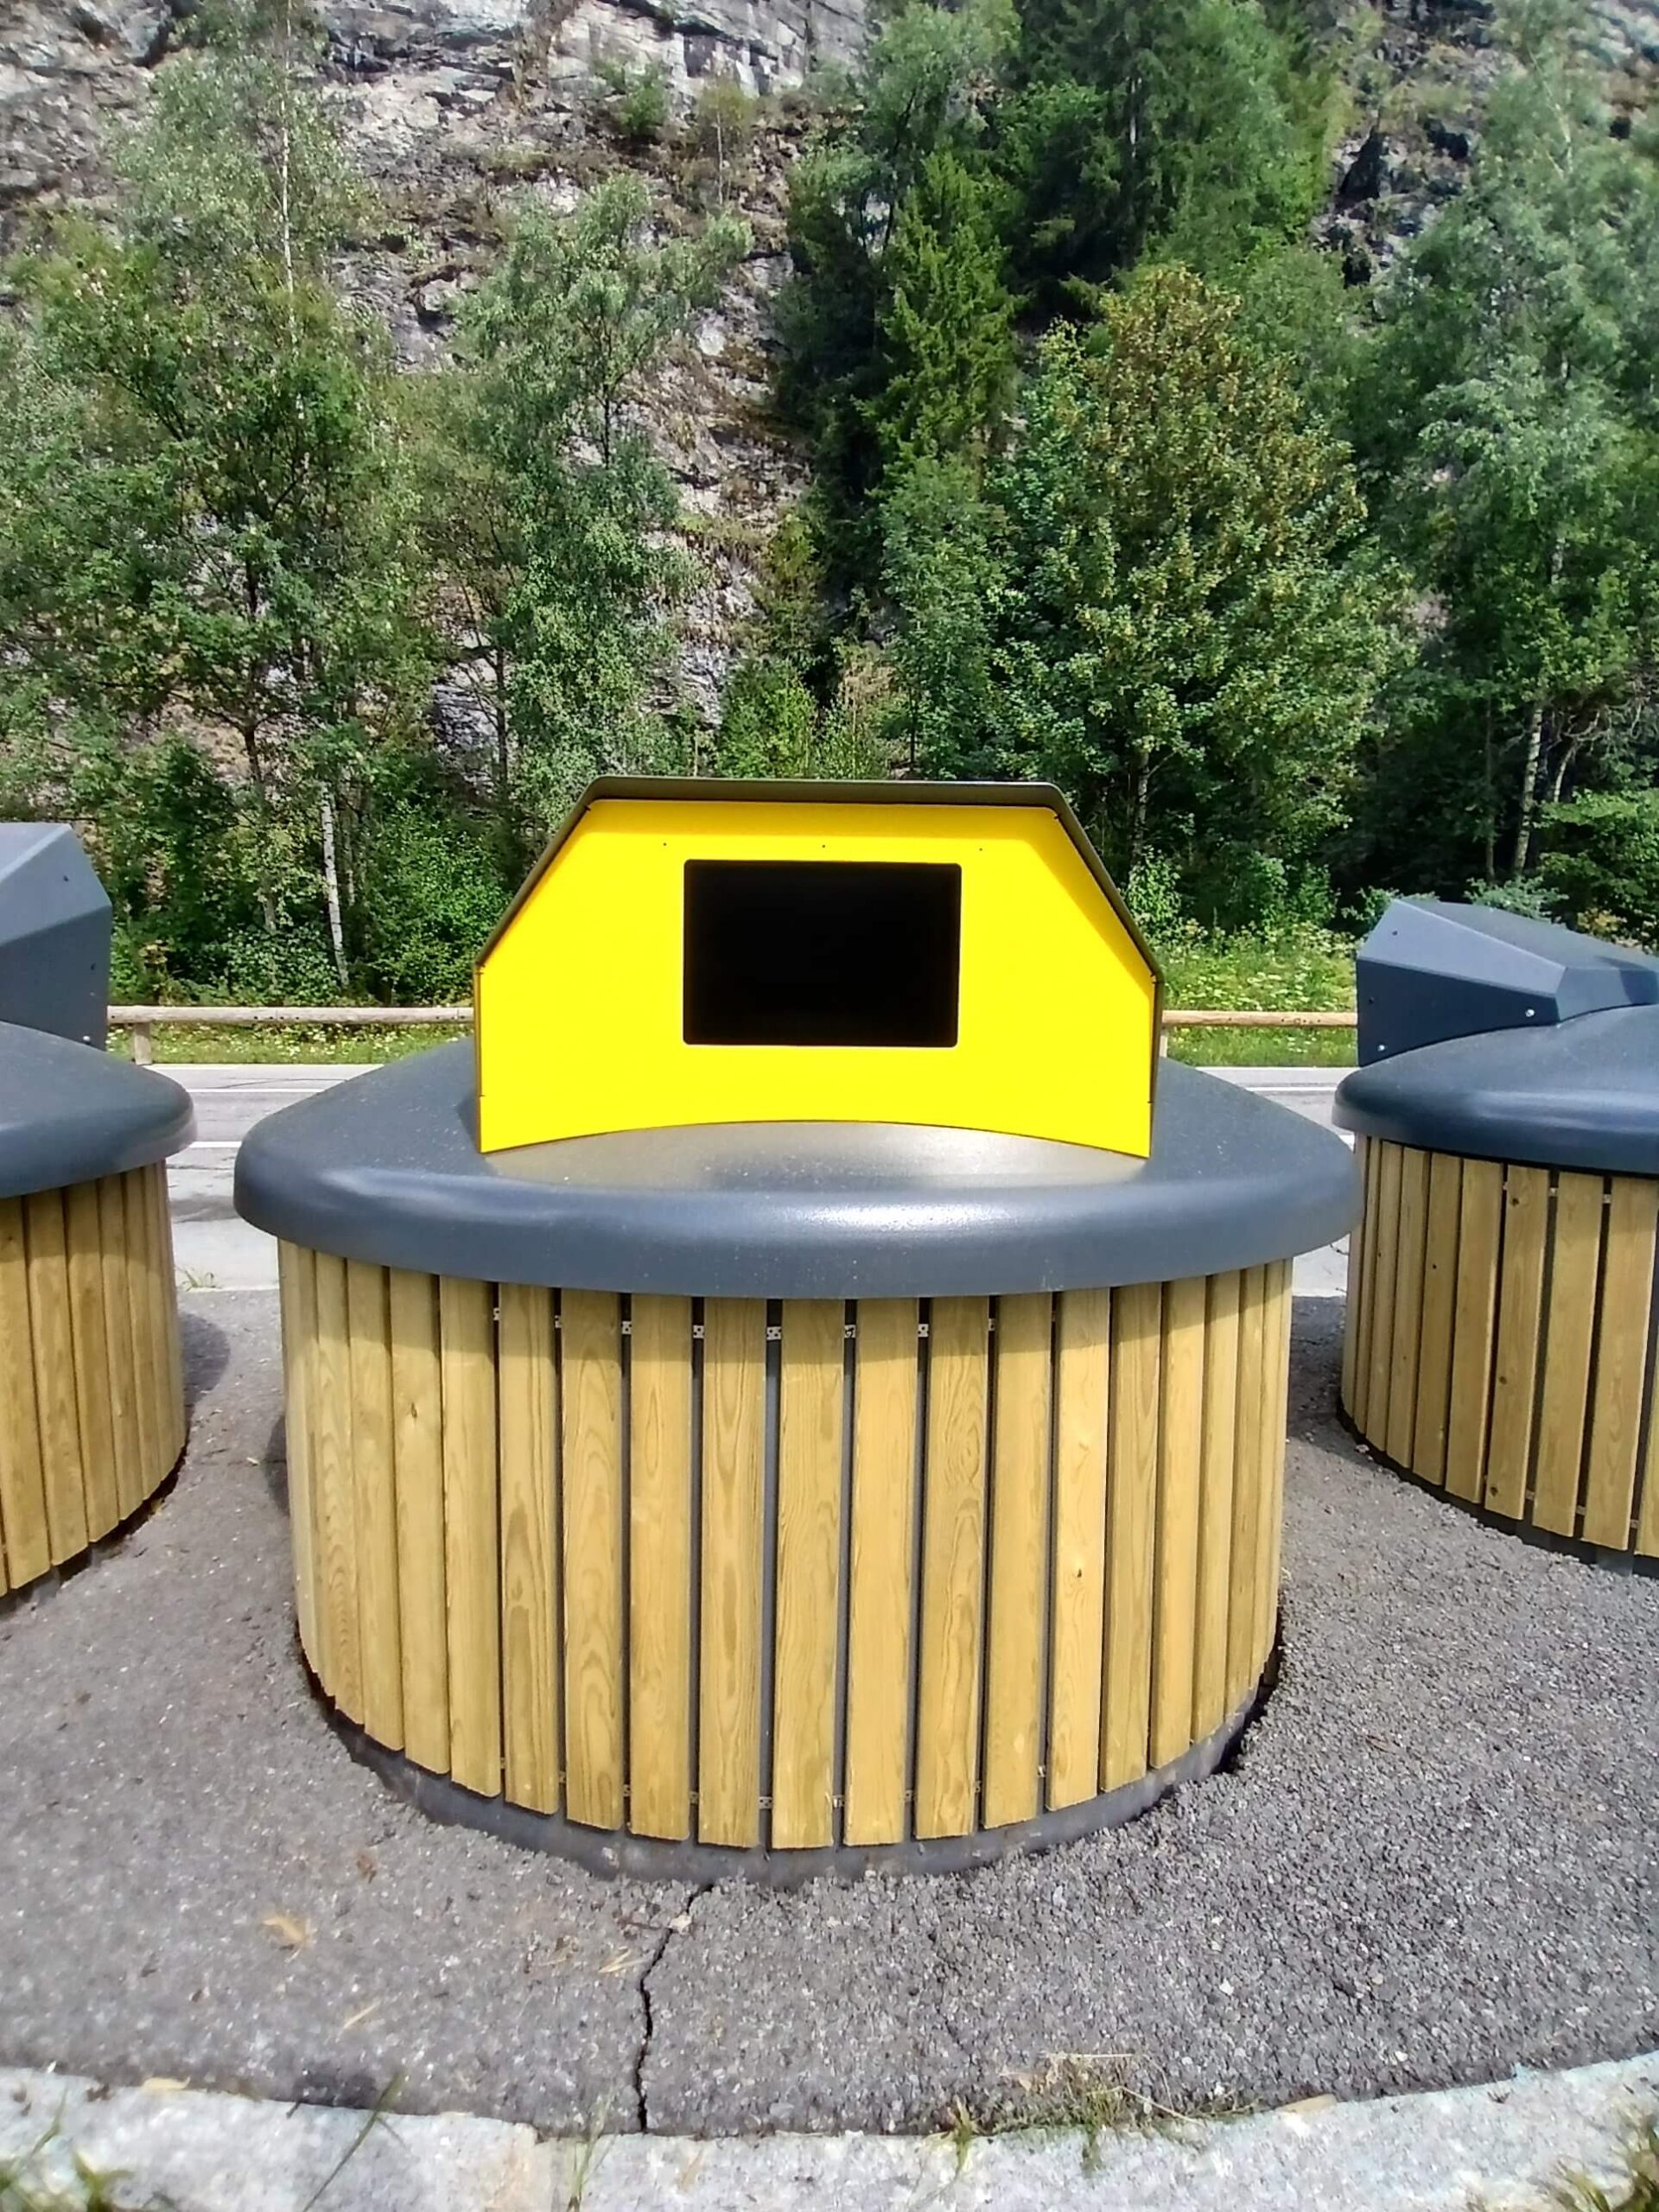
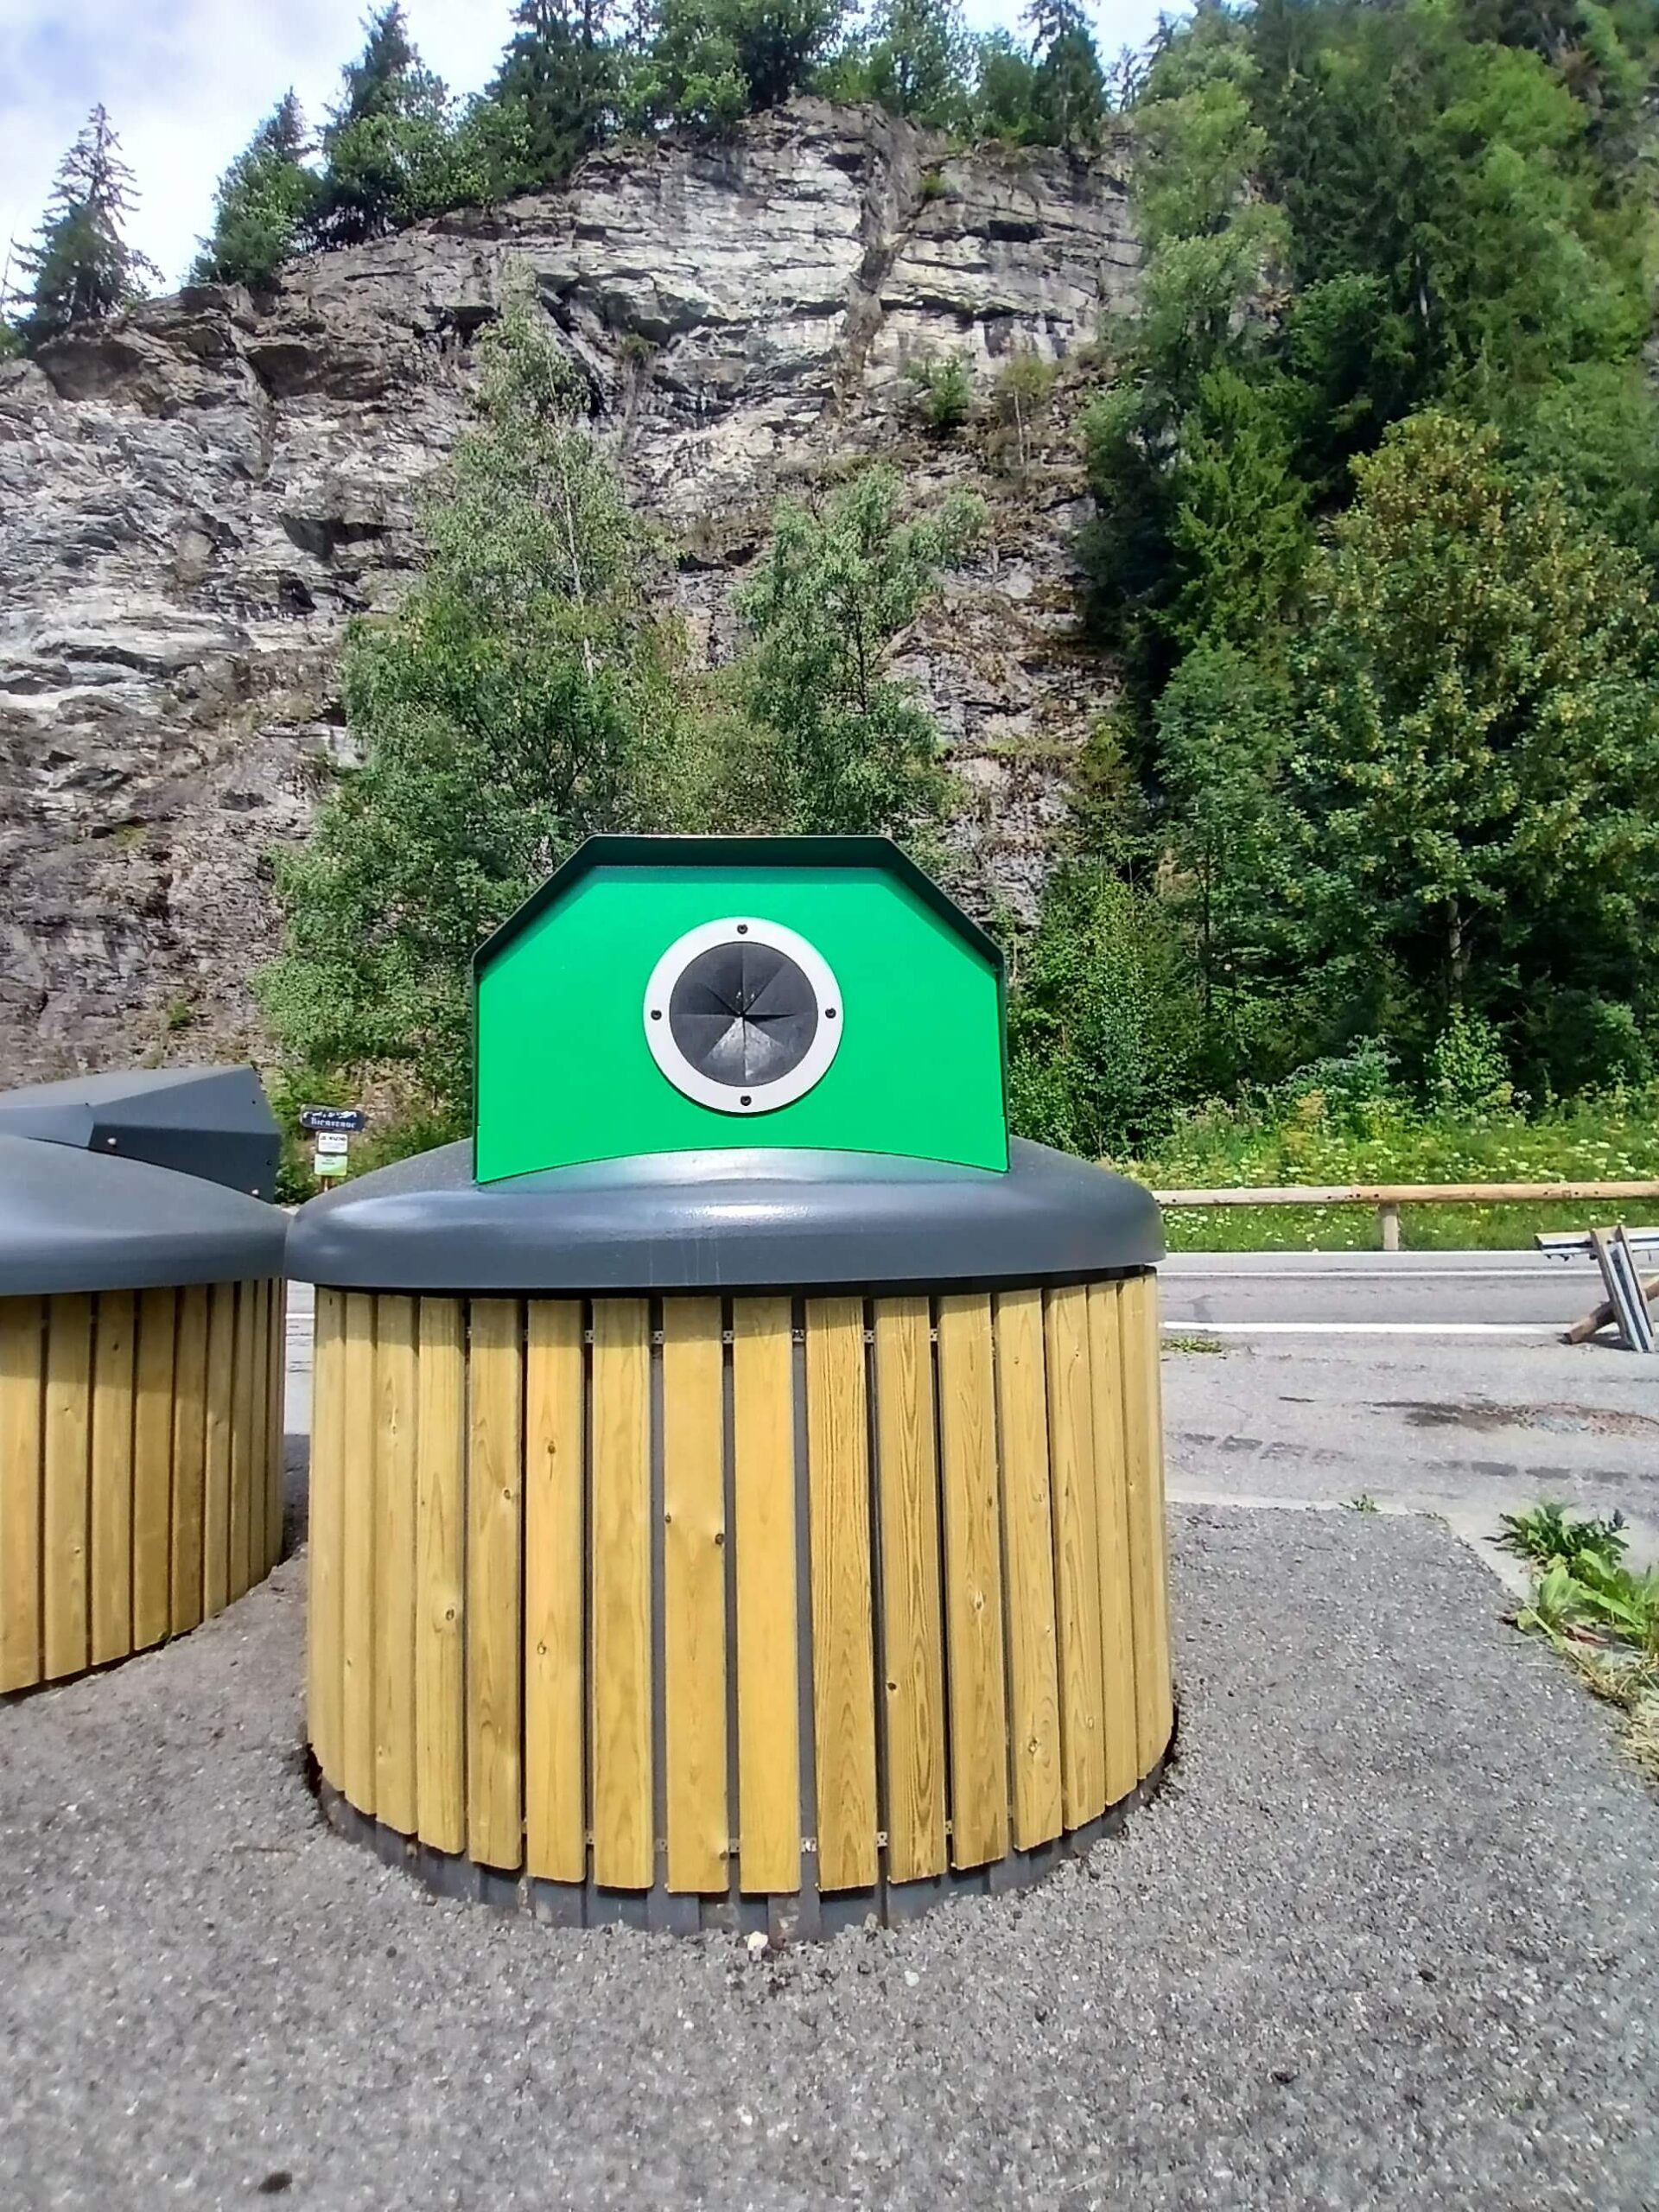
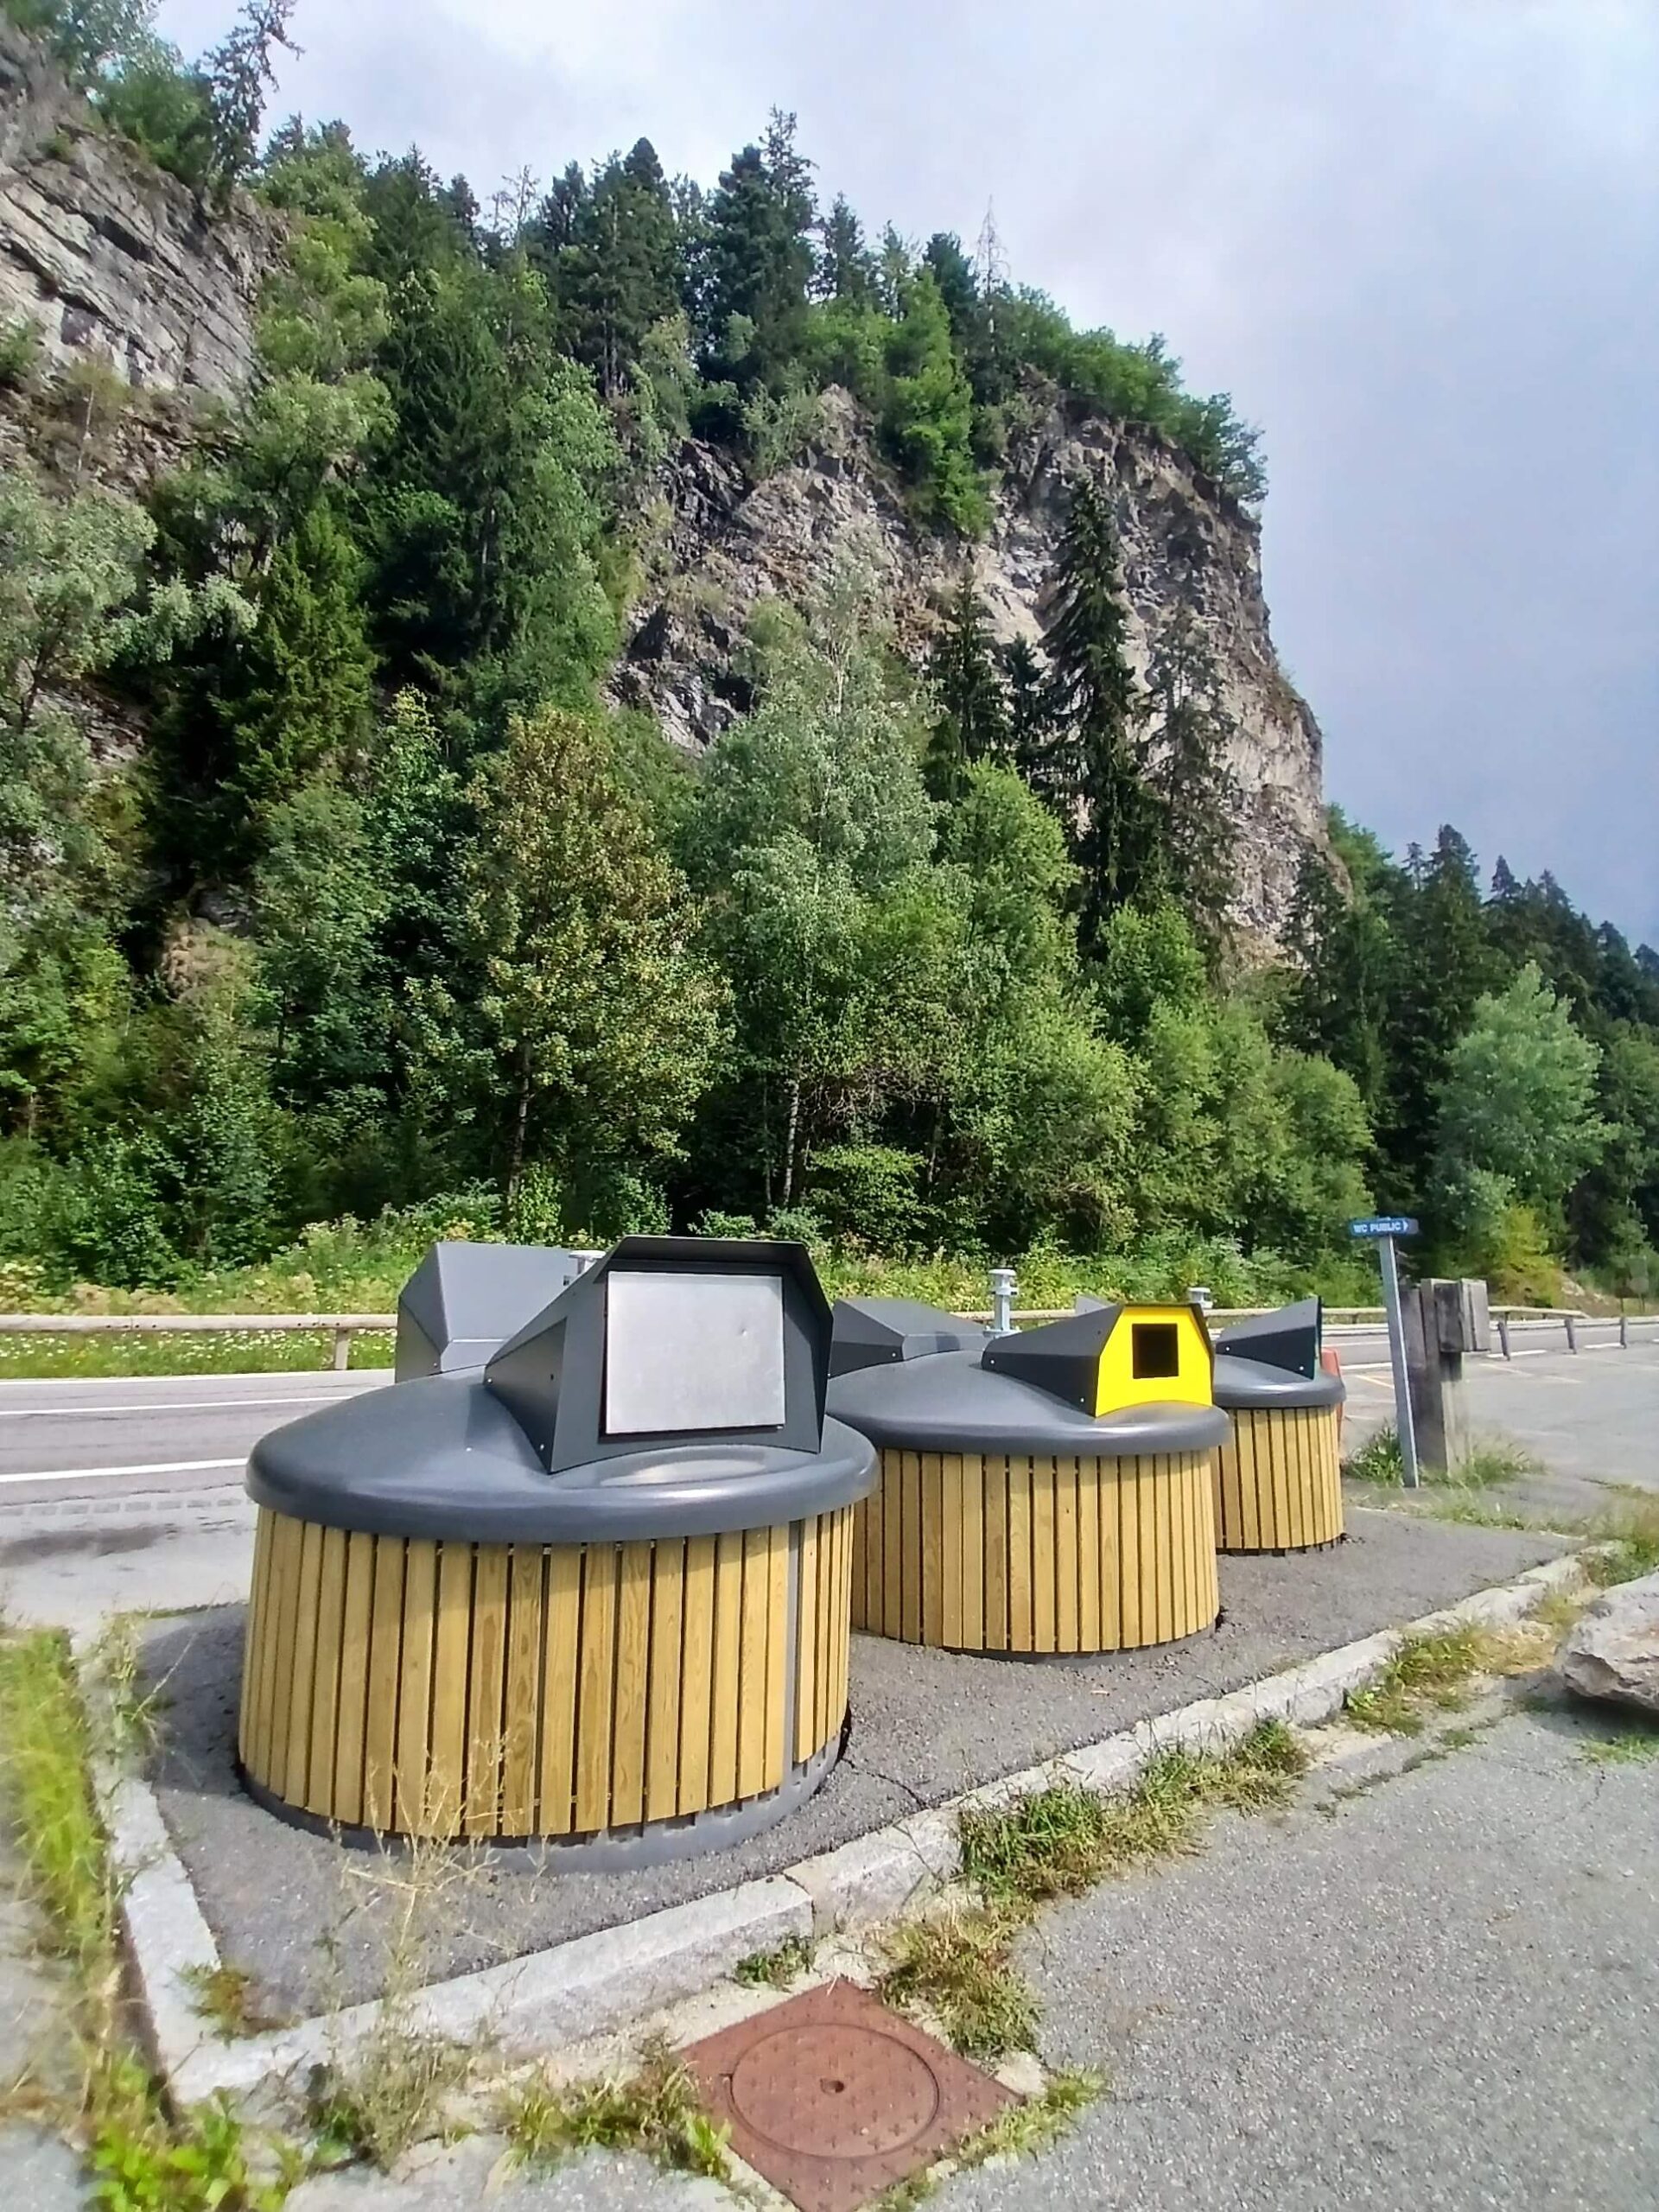
Photo highlights from the deployment across the Chamonix Mont-Blanc valley
FAQ
Do you manage a fleet of drop-off points?
Whether you run a fleet of connected drop-off points on an area with strong seasonality, terrain that blocks the signal or a wide-spread territory, the FOUR DATA team can show you what’s genuinely measurable at your site — and what isn’t.
Case study produced with the Régie Intercommunale Chamonix Propreté and its director Guillaume Pheulpin. Solution deployed by FOUR DATA (NOVA RADAR fill sensors, supervision platform, hosting in France) and Mobil Inn (iSmartCollect embedded software).
You may also be interested in these articles :